<xarray.Dataset>
Dimensions: (time: 353, lat: 33, lon: 38, bnds: 2)
Coordinates:
* lat (lat) float64 46.95 46.94 46.93 46.92 ... 46.68 46.67 46.66
* lon (lon) float64 11.03 11.03 11.04 11.05 ... 11.34 11.35 11.36
* time (time) datetime64[ns] 2021-02-01T09:57:08 ... 2021-06-30T20:...
time_bnds (time, bnds) datetime64[ns] dask.array<chunksize=(353, 2), meta=np.ndarray>
Dimensions without coordinates: bnds
Data variables:
F1 (time, lat, lon) float32 dask.array<chunksize=(1, 33, 38), meta=np.ndarray>
S1 (time, lat, lon) float32 dask.array<chunksize=(1, 33, 38), meta=np.ndarray>
S2 (time, lat, lon) float32 dask.array<chunksize=(1, 33, 38), meta=np.ndarray>
S3 (time, lat, lon) float32 dask.array<chunksize=(1, 33, 38), meta=np.ndarray>
S5 (time, lat, lon) float32 dask.array<chunksize=(1, 33, 38), meta=np.ndarray>
S6 (time, lat, lon) float32 dask.array<chunksize=(1, 33, 38), meta=np.ndarray>
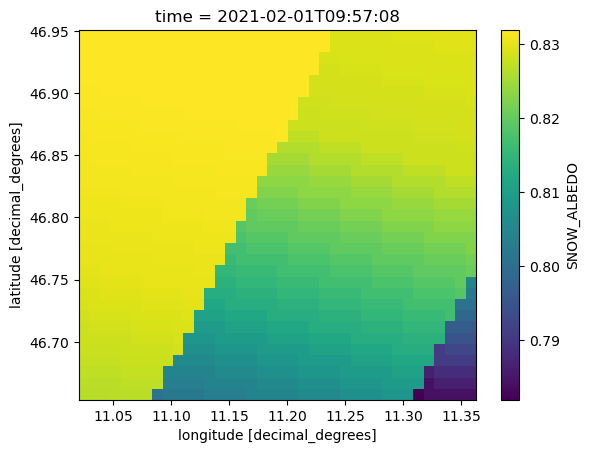
SNOW_ALBEDO (time, lat, lon) float32 dask.array<chunksize=(1, 33, 38), meta=np.ndarray>
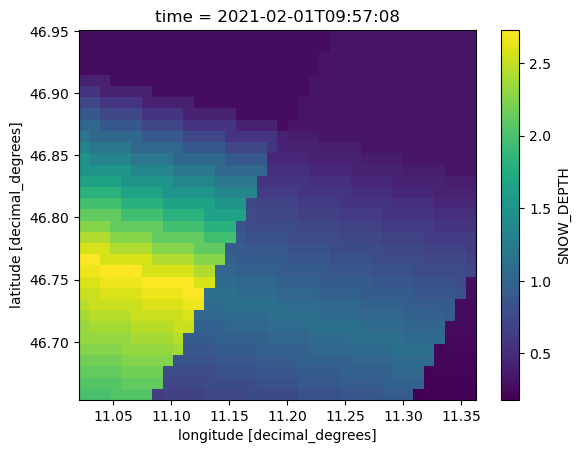
SNOW_DEPTH (time, lat, lon) float32 dask.array<chunksize=(1, 33, 38), meta=np.ndarray>
Attributes:
Conventions: CF-1.7
title: S3SLSTR Data Cube Subset
history: [{'program': 'xcube_sh.chunkstore.SentinelHubChu...
date_created: 2023-02-21T09:41:27.870387
time_coverage_start: 2021-02-01T09:37:22.665000+00:00
time_coverage_end: 2021-06-30T20:36:19.311000+00:00
time_coverage_duration: P149DT10H58M56.646S
geospatial_lon_min: 11.020833333333357
geospatial_lat_min: 46.653599378797765
geospatial_lon_max: 11.362833333333358
geospatial_lat_max: 46.95059937879776
processing_level: L1B Dimensions: time : 353lat : 33lon : 38bnds : 2
Coordinates: (4)
lat
(lat)
float64
46.95 46.94 46.93 ... 46.67 46.66
units : decimal_degrees long_name : latitude standard_name : latitude array([46.946099, 46.937099, 46.928099, 46.919099, 46.910099, 46.901099,
46.892099, 46.883099, 46.874099, 46.865099, 46.856099, 46.847099,
46.838099, 46.829099, 46.820099, 46.811099, 46.802099, 46.793099,
46.784099, 46.775099, 46.766099, 46.757099, 46.748099, 46.739099,
46.730099, 46.721099, 46.712099, 46.703099, 46.694099, 46.685099,
46.676099, 46.667099, 46.658099]) lon
(lon)
float64
11.03 11.03 11.04 ... 11.35 11.36
units : decimal_degrees long_name : longitude standard_name : longitude array([11.025333, 11.034333, 11.043333, 11.052333, 11.061333, 11.070333,
11.079333, 11.088333, 11.097333, 11.106333, 11.115333, 11.124333,
11.133333, 11.142333, 11.151333, 11.160333, 11.169333, 11.178333,
11.187333, 11.196333, 11.205333, 11.214333, 11.223333, 11.232333,
11.241333, 11.250333, 11.259333, 11.268333, 11.277333, 11.286333,
11.295333, 11.304333, 11.313333, 11.322333, 11.331333, 11.340333,
11.349333, 11.358333]) time
(time)
datetime64[ns]
2021-02-01T09:57:08 ... 2021-06-...
standard_name : time bounds : time_bnds array(['2021-02-01T09:57:08.000000000', '2021-02-01T21:00:17.000000000',
'2021-02-02T09:30:57.000000000', ..., '2021-06-30T09:13:24.000000000',
'2021-06-30T10:14:59.000000000', '2021-06-30T20:36:19.000000000'],
dtype='datetime64[ns]') time_bnds
(time, bnds)
datetime64[ns]
dask.array<chunksize=(353, 2), meta=np.ndarray>
Array
Chunk
Bytes
5.52 kiB
5.52 kiB
Shape
(353, 2)
(353, 2)
Dask graph
1 chunks in 2 graph layers
Data type
datetime64[ns] numpy.ndarray
2
353
Data variables: (8)
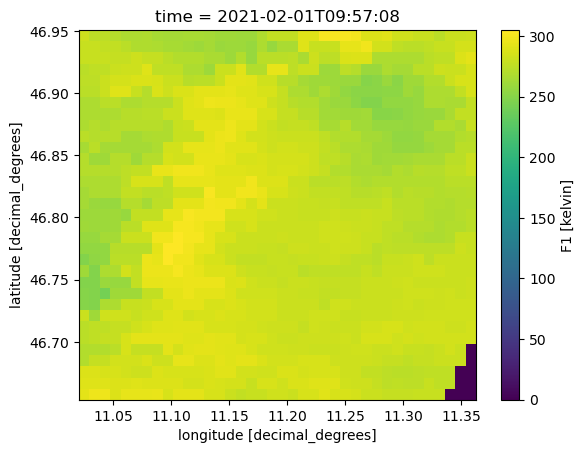
F1
(time, lat, lon)
float32
dask.array<chunksize=(1, 33, 38), meta=np.ndarray>
sample_type : UINT16 units : kelvin wavelength : 3742 bandwidth : 398.0 resolution : 1000
Array
Chunk
Bytes
1.69 MiB
4.90 kiB
Shape
(353, 33, 38)
(1, 33, 38)
Dask graph
353 chunks in 2 graph layers
Data type
float32 numpy.ndarray
38
33
353
S1
(time, lat, lon)
float32
dask.array<chunksize=(1, 33, 38), meta=np.ndarray>
sample_type : UINT16 units : reflectance wavelength : 554.27 bandwidth : 19.26 resolution : 500
Array
Chunk
Bytes
1.69 MiB
4.90 kiB
Shape
(353, 33, 38)
(1, 33, 38)
Dask graph
353 chunks in 2 graph layers
Data type
float32 numpy.ndarray
38
33
353
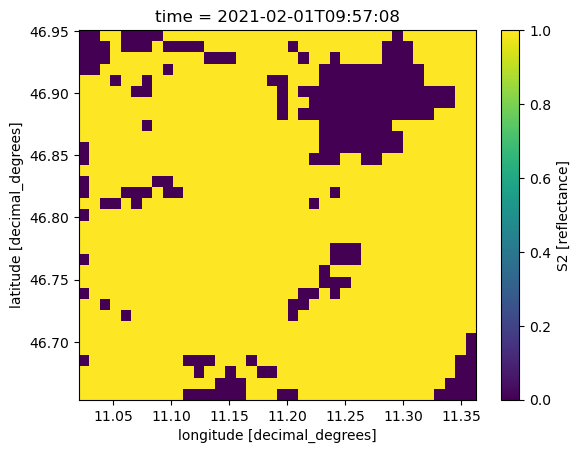
S2
(time, lat, lon)
float32
dask.array<chunksize=(1, 33, 38), meta=np.ndarray>
sample_type : UINT16 units : reflectance wavelength : 659.47 bandwidth : 19.25 resolution : 500
Array
Chunk
Bytes
1.69 MiB
4.90 kiB
Shape
(353, 33, 38)
(1, 33, 38)
Dask graph
353 chunks in 2 graph layers
Data type
float32 numpy.ndarray
38
33
353
S3
(time, lat, lon)
float32
dask.array<chunksize=(1, 33, 38), meta=np.ndarray>
sample_type : UINT16 units : reflectance wavelength : 868 bandwidth : 20.6 resolution : 500
Array
Chunk
Bytes
1.69 MiB
4.90 kiB
Shape
(353, 33, 38)
(1, 33, 38)
Dask graph
353 chunks in 2 graph layers
Data type
float32 numpy.ndarray
38
33
353
S5
(time, lat, lon)
float32
dask.array<chunksize=(1, 33, 38), meta=np.ndarray>
sample_type : UINT16 units : reflectance wavelength : 1613.4 bandwidth : 60.68 resolution : 500
Array
Chunk
Bytes
1.69 MiB
4.90 kiB
Shape
(353, 33, 38)
(1, 33, 38)
Dask graph
353 chunks in 2 graph layers
Data type
float32 numpy.ndarray
38
33
353
S6
(time, lat, lon)
float32
dask.array<chunksize=(1, 33, 38), meta=np.ndarray>
sample_type : UINT16 units : reflectance wavelength : 2255.7 bandwidth : 50.15 resolution : 500
Array
Chunk
Bytes
1.69 MiB
4.90 kiB
Shape
(353, 33, 38)
(1, 33, 38)
Dask graph
353 chunks in 2 graph layers
Data type
float32 numpy.ndarray
38
33
353
SNOW_ALBEDO
(time, lat, lon)
float32
dask.array<chunksize=(1, 33, 38), meta=np.ndarray>
Array
Chunk
Bytes
1.69 MiB
4.90 kiB
Shape
(353, 33, 38)
(1, 33, 38)
Dask graph
353 chunks in 2 graph layers
Data type
float32 numpy.ndarray
38
33
353
SNOW_DEPTH
(time, lat, lon)
float32
dask.array<chunksize=(1, 33, 38), meta=np.ndarray>
Array
Chunk
Bytes
1.69 MiB
4.90 kiB
Shape
(353, 33, 38)
(1, 33, 38)
Dask graph
353 chunks in 2 graph layers
Data type
float32 numpy.ndarray
38
33
353
Indexes: (3)
PandasIndex
PandasIndex(Float64Index([ 46.94609937879776,  46.93709937879776,  46.92809937879776,
               46.91909937879776,  46.91009937879776,  46.90109937879776,
               46.89209937879776,  46.88309937879776, 46.874099378797766,
              46.865099378797765, 46.856099378797765, 46.847099378797765,
              46.838099378797764, 46.829099378797764, 46.820099378797764,
               46.81109937879776,  46.80209937879776,  46.79309937879776,
               46.78409937879776,  46.77509937879776,  46.76609937879776,
               46.75709937879776,  46.74809937879776,  46.73909937879776,
               46.73009937879776,  46.72109937879777,  46.71209937879777,
              46.703099378797766, 46.694099378797766, 46.685099378797766,
              46.676099378797765, 46.667099378797765, 46.658099378797765],
dtype='float64', name='lat')) PandasIndex
PandasIndex(Float64Index([11.025333333333357, 11.034333333333358, 11.043333333333358,
              11.052333333333356, 11.061333333333357, 11.070333333333357,
              11.079333333333357, 11.088333333333358, 11.097333333333356,
              11.106333333333357, 11.115333333333357, 11.124333333333357,
              11.133333333333358, 11.142333333333358, 11.151333333333357,
              11.160333333333357, 11.169333333333357, 11.178333333333358,
              11.187333333333358, 11.196333333333357, 11.205333333333357,
              11.214333333333357, 11.223333333333358, 11.232333333333358,
              11.241333333333356, 11.250333333333357, 11.259333333333357,
              11.268333333333358, 11.277333333333358, 11.286333333333356,
              11.295333333333357, 11.304333333333357, 11.313333333333357,
              11.322333333333358, 11.331333333333358, 11.340333333333357,
              11.349333333333357, 11.358333333333357],
dtype='float64', name='lon')) PandasIndex
PandasIndex(DatetimeIndex(['2021-02-01 09:57:08', '2021-02-01 21:00:17',
               '2021-02-02 09:30:57', '2021-02-02 20:53:51',
               '2021-02-03 09:24:32', '2021-02-03 20:47:26',
               '2021-02-04 09:59:48', '2021-02-04 20:21:15',
               '2021-02-04 21:22:43', '2021-02-05 09:53:23',
               ...
               '2021-06-27 09:52:33', '2021-06-27 20:13:52',
               '2021-06-27 21:15:27', '2021-06-28 09:46:04',
               '2021-06-28 21:08:59', '2021-06-29 09:19:53',
               '2021-06-29 20:42:48', '2021-06-30 09:13:24',
               '2021-06-30 10:14:59', '2021-06-30 20:36:19'],
              dtype='datetime64[ns]', name='time', length=353, freq=None))
Attributes: (12)
Conventions : CF-1.7 title : S3SLSTR Data Cube Subset history : [{'program': 'xcube_sh.chunkstore.SentinelHubChunkStore', 'cube_config': {'dataset_name': 'S3SLSTR', 'band_names': ['S1', 'S2', 'S3', 'S5', 'S6', 'F1', 'SNOW_DEPTH', 'SNOW_ALBEDO'], 'band_fill_values': None, 'band_sample_types': None, 'band_units': None, 'tile_size': [38, 33], 'bbox': [11.020833333333357, 46.653599378797765, 11.362833333333358, 46.95059937879776], 'spatial_res': 0.009, 'crs': 'WGS84', 'upsampling': 'NEAREST', 'downsampling': 'NEAREST', 'mosaicking_order': 'mostRecent', 'time_range': ['2021-02-01T00:00:00+00:00', '2021-07-01T00:00:00+00:00'], 'time_period': None, 'time_tolerance': '0 days 00:10:00', 'collection_id': None, 'four_d': False}}] date_created : 2023-02-21T09:41:27.870387 time_coverage_start : 2021-02-01T09:37:22.665000+00:00 time_coverage_end : 2021-06-30T20:36:19.311000+00:00 time_coverage_duration : P149DT10H58M56.646S geospatial_lon_min : 11.020833333333357 geospatial_lat_min : 46.653599378797765 geospatial_lon_max : 11.362833333333358 geospatial_lat_max : 46.95059937879776 processing_level : L1B