What is a data cube?#
Learning objectives#
Understand what data cubes are and why they are needed
Learn what dimensions are
Understand the role of data cubes in EO cloud platforms
Data Cubes in General#
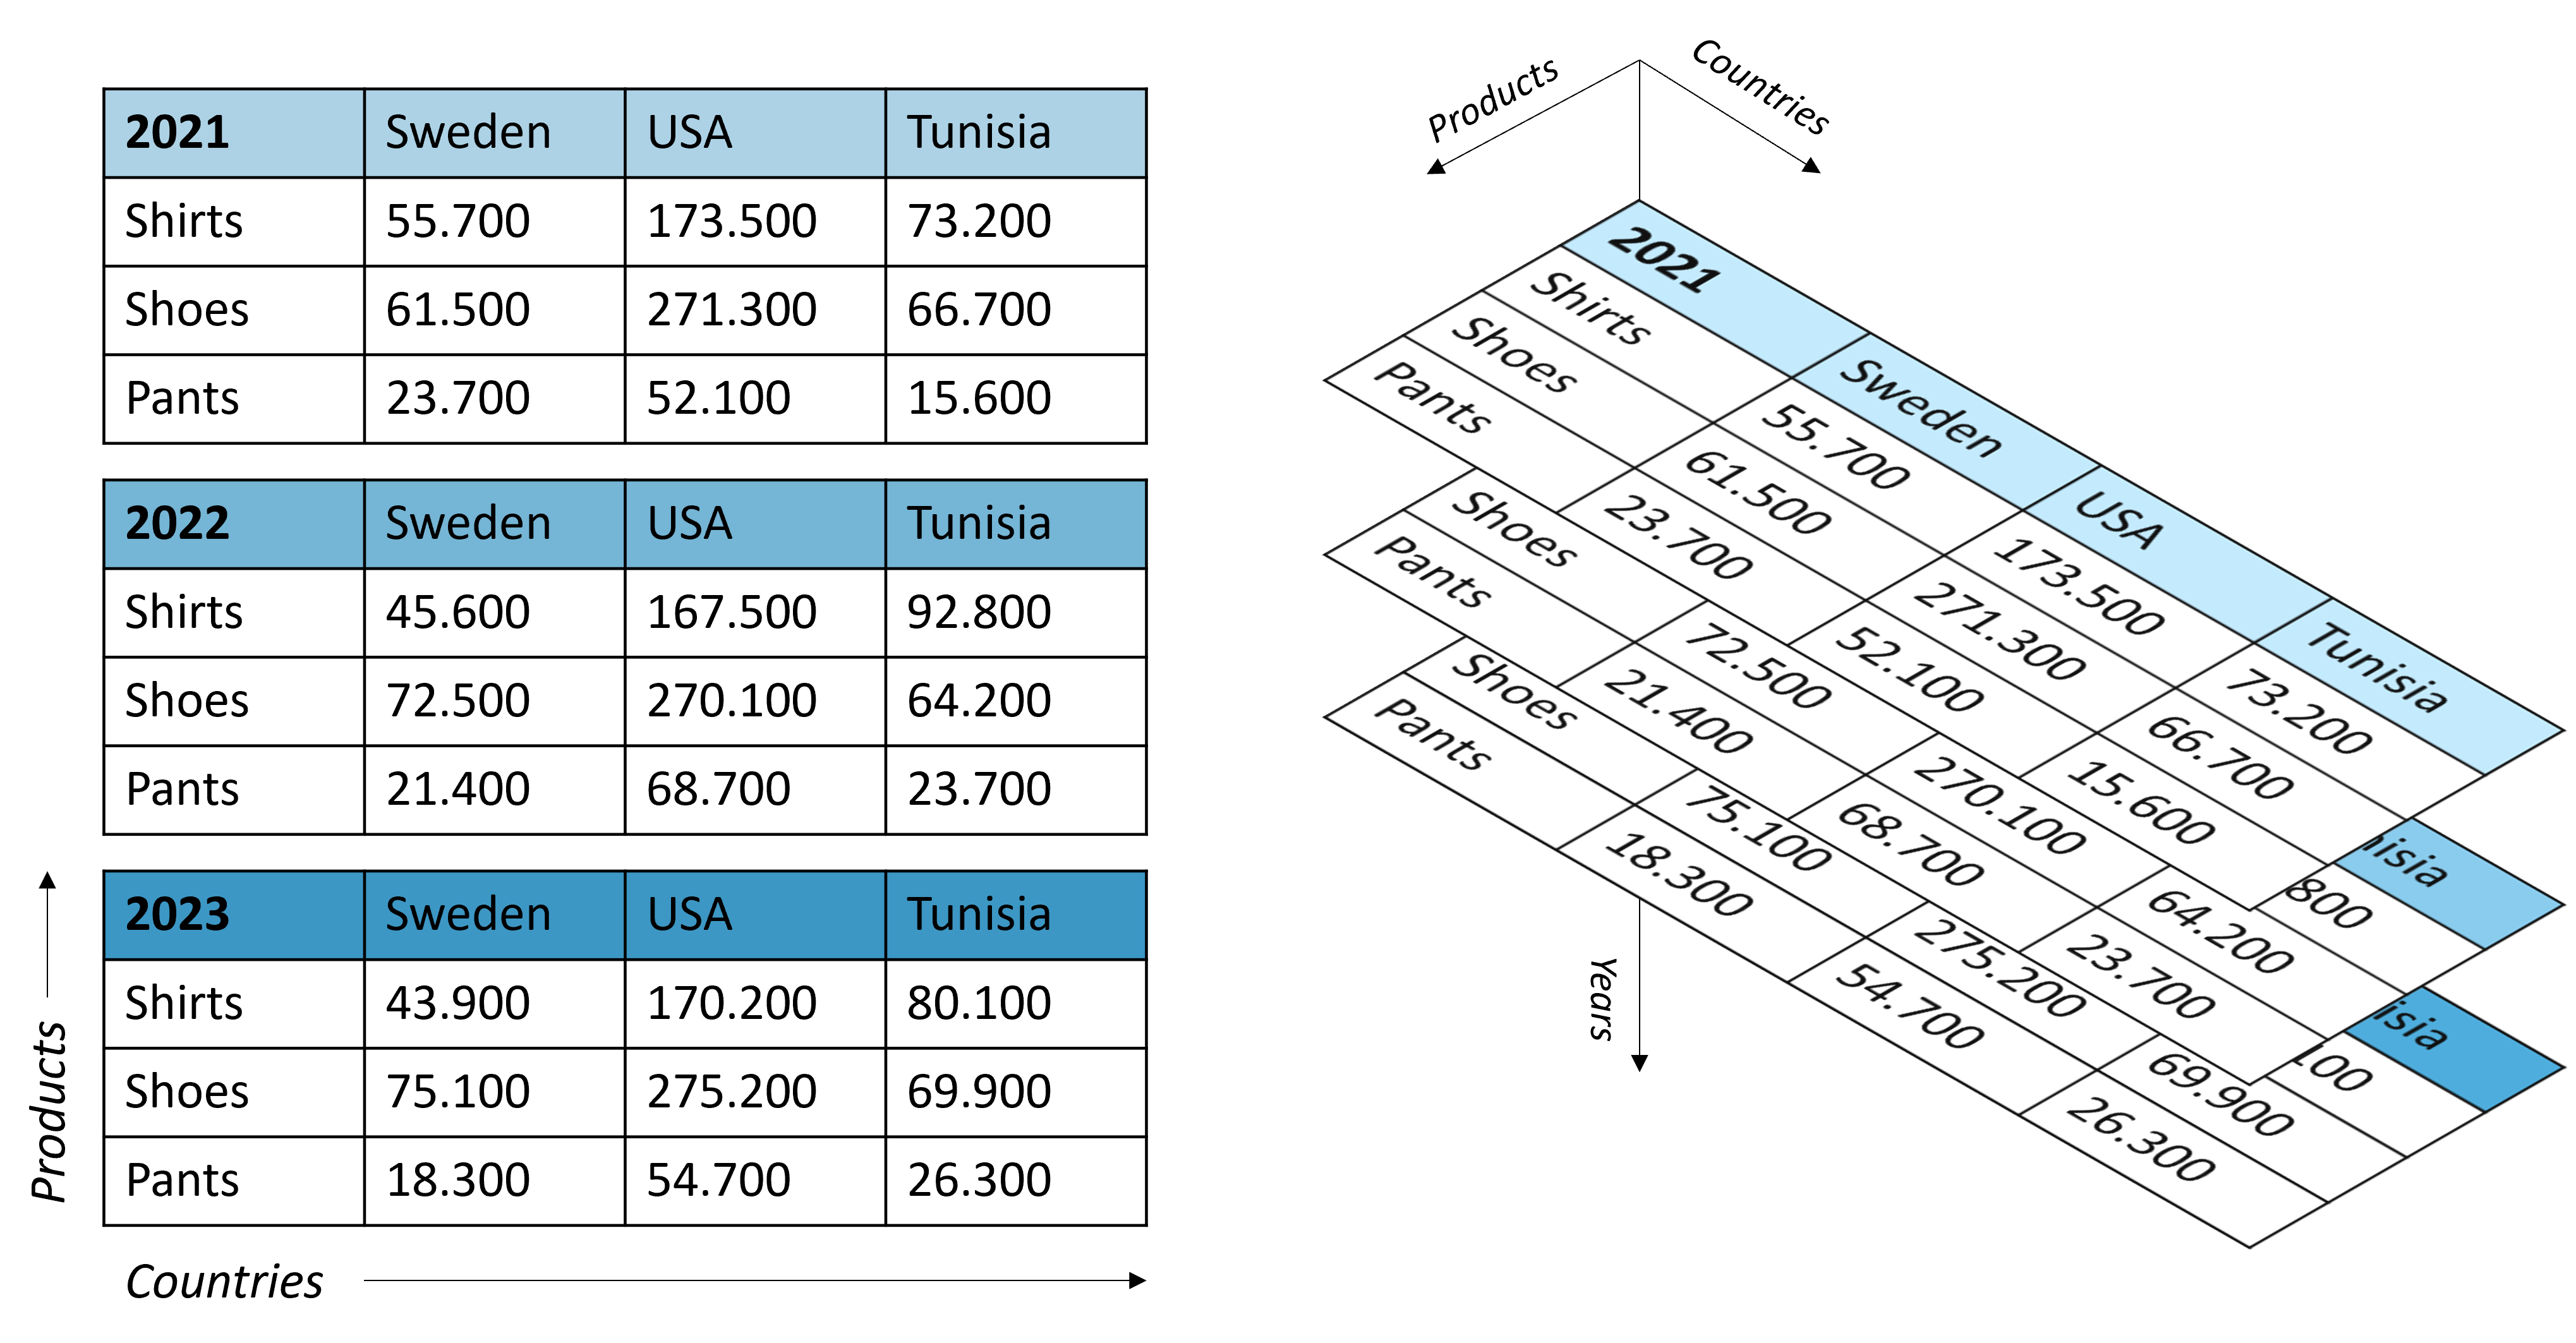
When you think about data, most likely tables come to your mind, with features organized in rows and columns. Data cubes overcome these constraints: they are a data structure that allows to represent data in more than only two dimensions. Generally a data cube is a multi-dimensional data structure. Even though it’s called a cube, it is n-dimensional. A 1-d data cube is an array. A 2-d data cube is a table. A 3-d data cube is a cube. A 4-d data cube is hard to visualize. A feature within a data cube is explained by multiple dimensions and has a certain value. An example would be: A company has sold multiple products (Shirts, Shoes, Pants), in different countries (Sweden, USA, Tunisia), in different years (2021, 2022, 2023).
Dimensions: Products, Locations, Years
Labels of the Dimensions:
Products: Shrits, Shoes, Pants
Countries: Sweden, USA, Tunisia
Years: 2021, 2022, 2023
Feature: Revenue
Value: $
This concept can be applied to many fields such as economics, medicine, biology, and also very well to EO data!
Data Cubes in EO#
The concept of representing multidimensional data as data cubes fits ideally to the challenges of representing satellite data that is usually dealing with multiple dimensions such as: lat, lon, time, bands, etc. In the video below it becomes very clear what the strengths of data cubes in EO are.
An example data cube#
Data can be represented as datacubes in EO, which are multi-dimensional arrays with additional information about their dimensionality. Datacubes can provide a nice and tidy interface for spatiotemporal data as well as for the operations you may want to execute on them. As they are arrays, it might be easiest to look at raster data as an example, even though datacubes can hold vector data as well. Our example data however consists of a 6x7 raster with 4 bands [blue, green, red, near-infrared] and 3 timesteps [2020-10-01, 2020-10-13, 2020-10-25], displayed here in an orderly, timeseries-like manner:
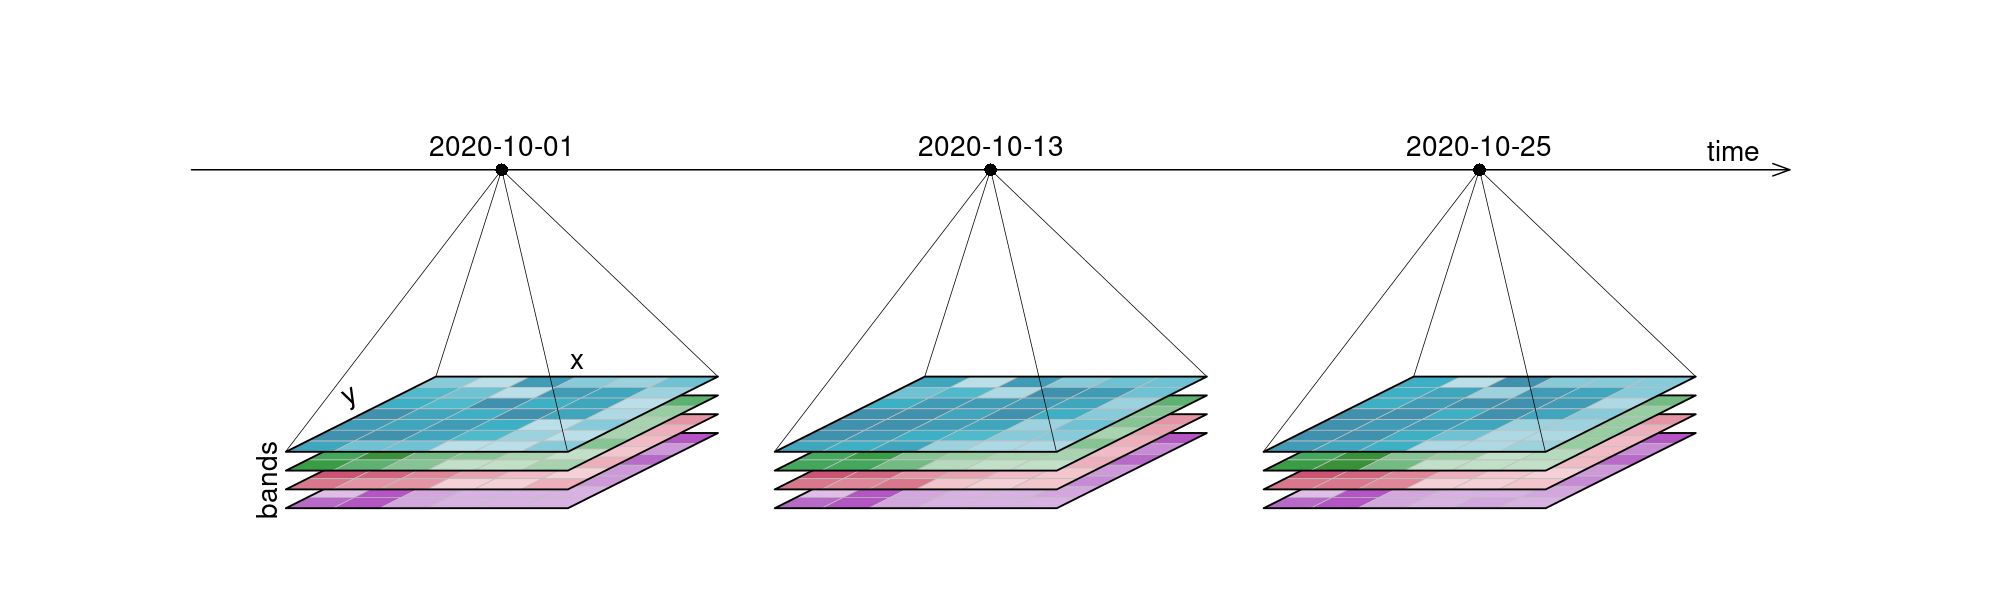
Figure: An examplary raster datacube with 4 dimensions: x, y, bands and time. Reference: openeo.org (2022). What are Data Cubes.
It is important to understand that datacubes are designed to make things easier for us, and are not literally a cube, meaning that the above plot is just as good a representation as any other. That is why we can switch the dimensions around and display them in whatever way we want, including the view below:
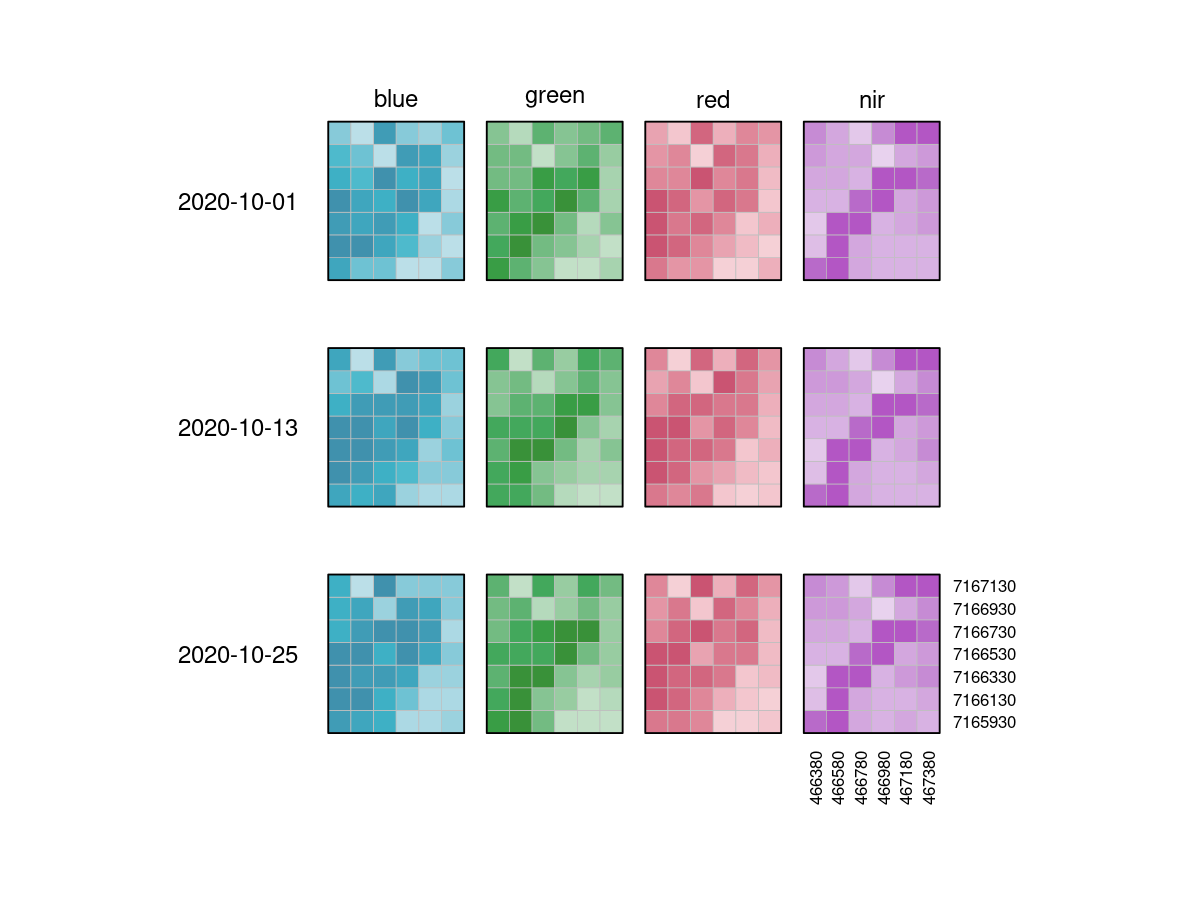
Figure: Raster datacube flat representation: The 12 imagery tiles are now laid out flat as a 4 by 3 grid (bands by timesteps). All dimension labels are depicted (The timestamps, the band names and the x, y coordinates). Reference: openeo.org (2022). What are Data Cubes.
Dimensions#
A dimension refers to a certain axis of a datacube. This includes all variables (e.g. bands), which are represented as dimensions. Our exemplary raster datacube has the spatial dimensions x and y, and the temporal dimension t. Furthermore, it has a bands dimension, extending into the realm of what kind of information is contained in the cube.
The following properties are usually available for dimensions:
name
type (potential types include: spatial (raster or vector data), temporal and other data such as bands)
axis (for spatial dimensions) / number
labels (usually exposed through textual or numerical representations, in the metadata as nominal values and/or extents)
reference system / projection
resolution / step size
unit (either explicitly specified or implicitly given by the reference system)
additional information specific to the dimension type (e.g. the geometry types for a dimension containing geometries)
Here is an overview of the dimensions contained in our example raster datacube above:
# |
name |
type |
labels |
resolution |
reference system |
|---|---|---|---|---|---|
1 |
|
spatial |
|
200m |
|
2 |
|
spatial |
|
200m |
|
3 |
|
bands |
|
4 bands |
- |
4 |
|
temporal |
|
12 days |
Gregorian calendar / UTC |
Table: Overview of the dimensions contained in our example raster datacube above. Reference: openeo.org (2022). What are Data Cubes.
Dimension labels are usually either numerical or text (also known as “strings”), which also includes textual representations of timestamps or geometries for example. For example, temporal labels are usually encoded as ISO 8601 compatible dates and/or times and similarly geometries can be encoded as Well-known Text (WKT) or be represented by their IDs.
Dimensions with a natural/inherent order (usually all temporal and spatial raster dimensions) are always sorted. Dimensions without inherent order (usually bands), retain the order in which they have been defined in metadata or processes (e.g. through filter_bands), with new labels simply being appended to the existing labels.
Geometry as a Dimension#
A geometry dimension is not included in the example raster datacube above and it is not used in the following examples, but to show how a vector dimension with two polygons could look like:
name |
type |
labels |
reference system |
|---|---|---|---|
|
vector |
|
Table: Geometry as a Dimension. Reference: openeo.org (2022). What are Data Cubes.
A dimension with geometries can consist of points, linestrings, polygons, multi points, multi linestrings, or multi polygons. It is not possible to mix geometry types, but the single geometry type with their corresponding multi type can be combined in a dimension (e.g. points and multi points).
EO datacubes contain scalar values (e.g. strings, numbers or boolean values), with all other associated attributes stored in dimensions (e.g. coordinates or timestamps). Attributes such as the CRS or the sensor can also be turned into dimensions. Be advised that in such a case, the uniqueness of pixel coordinates may be affected. When usually, (x, y) refers to a unique location, that changes to (x, y, CRS) when (x, y) values are reused in other coordinate reference systems (e.g. two neighboring UTM zones).
Coordinate Reference System as a Dimension#
In the example above, x and y dimension values have a unique relationship to world coordinates through their coordinate reference system (CRS). This implies that a single coordinate reference system is associated with these x and y dimensions. If we want to create a data cube from multiple tiles spanning different coordinate reference systems (e.g. Sentinel-2: different UTM zones), we would have to resample/warp those to a single coordinate reference system. In many cases, this is wanted because we want to be able to look at the result, meaning it is available in a single coordinate reference system.
Resampling is however costly, involves (some) data loss, and is in general not reversible. Suppose that we want to work only on the spectral and temporal dimensions of a data cube, and do not want to do any resampling. In that case, one could create one data cube for each coordinate reference system. An alternative would be to create one single data cube containing all tiles that has an additional dimension with the coordinate reference system. In that data cube, x and y no longer point to a unique world coordinate, because identical x and y coordinate pairs occur in each UTM zone. Now, only the combination (x, y, crs) has a unique relationship to the world coordinates.
On such a crs-dimensioned data cube, several operations make perfect sense, such as apply or reduce_dimension on spectral and/or temporal dimensions. A simple reduction over the crs dimension, using sum or mean would typically not make sense. The “reduction” (removal) of the crs dimension that is meaningful involves the resampling/warping of all sub-cubes for the crs dimension to a single, common target coordinate reference system.
Resolution#
The resolution of a dimension gives information about what interval lies between observations. This is most obvious with the temporal resolution, where the intervals depict how often observations were made. Spatial resolution gives information about the pixel spacing, meaning how many ‘real world meters’ are contained in a pixel. The number of bands and their wavelength intervals give information about the spectral resolution.
Images generated by LexCube - Leipzig Explorer of Earth Data Cubes by Maximilian Söchting

Video content in cooperation with Gunnar Brandt (Brockmann Consult), Pontus Lurcock (Brockmann Consult) and Miguel Mahecha (University of Leipzig).
Data Cubes in Cloud Platforms#
One important feature of an EO cloud platform is to host satellite data. Usually vast amounts of satellite data, for example the whole archive of Landsat and the Sentinels which adds up to Petabytes of data. Users want to access this data efficiently. Therefore the storage system of an EO cloud platform needs to be optimized towards user requests. Data Cubes play an important role here. Organizing the raw files into virtual data cubes solves many issues for EO cloud platforms.
Data Management: Different Satellites have different formats and are structured differently. This can easily create confusion because the different sources have to be treated differently. After organizing these files into data cubes the interaction with all different satellite data follows the same rules.
Separated Collections: Every satellite missions images form an own data cube, also called collection, with its according metadata. Ideally cloud processing tools on the platform allow for easy data fusion of different collections.
Flexible Subsetting: Data Cube Management Systems are developed to facilitate subsetting operations along the different dimensions and return only the required subset. Without worrying about the different raw files that are involved (e.g. area of interest is crossing a tile border).
:warning: Remember, a data cube is not an EO cloud platform. It’s only one part of it.
Further Reading#
References#
Quiz#
What is a two dimensional data cube?
[( )] vector, a one dimensional array
[( )] atomic feature, a single value
[(x)] table, in EO a raster
Check the typical dimensions of an EO data cube.
[[x]] x
[[ ]] rain
[[x]] y
[[ ]] function
[[x]] time
[[ ]] world
[[x]] bands
What is the main puorpose of a geometry dimension?
[(x)] storing geometries (e.g. polygons, points)
[( )] it's holding the bounding box of the data cube
[( )] defining the shape of the pixels
Attach the resolutions to their dimensions
[[x and y] [time] [band]
[(X) ( ) ( ) ] meter, kilometer, degrees
[( ) (X) ( ) ] days, hours, years
[( ) ( ) (X) ] micrometers, color
What are the advantages of data cubes in EO?
[[x]] EO data is multidimensional data cubes allow to represent this
[[ ]] Data cubes introduce an unnecessary layer of complexity that is not needed in EO
[[ ]] The file size of EO data is drastically reduced
What are the advantages of data cubes in cloud platforms?
[[x]] The user is not confronted with multiple files and file types
[[x]] Different satellite missions can be stored in different data cubes that can be combined for analysis on the platform
[[x]] subsetting operations become very powerful - users only receive the extents they are interested in.