Parts 1 and 2 made the case that equal-area cells matter for biodiversity counts. That argument is already won in practice: global biodiversity maps are routinely projected through equal-area cylindrical projections such as Behrmann or Mollweide before binning, precisely so that cell counts reflect density rather than projection geometry.
So why DGGS instead of an equal-area projection?
Because for AI-ready, multi-resolution, cloud-native analysis, equal-area is not enough. An equal-area projection fixes the area bias but introduces three new problems:
Cell shape distortion (anisotropy). A Behrmann cell at the equator is square-ish. The same cell at 70°N is the same area but several times wider than tall. A CNN’s 3×3 kernel covers the same number of cells everywhere, but a wildly different physical shape of geography. Models cannot learn consistent spatial operators on inconsistent neighborhoods.
No native multi-resolution hierarchy. Refining a 100 km Behrmann grid to 50 km requires reprojection and rebinning, with interpolation artefacts. HEALPix
nsidedoubling produces exactly 4 children per parent, deterministically, with no resampling.Pole degeneracies (Mollweide). Mollweide compresses both poles to single points; polar cells degenerate. Behrmann avoids this but pays in extreme cell elongation. HEALPix uses no projection — cells live directly on the sphere.
This notebook illustrates (1) — the most visually direct of the three arguments — and quantifies it across the latitudes that actually matter for biodiversity (0° to 70°N).
import os
import shutil

import cartopy.crs as ccrs
import geopandas as gpd
import h3
import healpix_geo.nested as hgn
import healpy as hp
import matplotlib.pyplot as plt
import numpy as np
from dggrid4py import DGGRIDv7
from matplotlib.patches import Polygon
from rhealpixdggs.rhp_wrappers import geo_to_rhp, rhp_to_geo_boundary
from shapely.geometry import Point

R = 6371.0  # Earth radius, km
DEG = np.pi / 180.0

# DGGRID handle, used by ISEA3H cell builder. Found via DGGRID_PATH env
# var (set in Docker image) or PATH (conda-forge dggrid).
_dggrid_bin = os.environ.get("DGGRID_PATH") or shutil.which("dggrid")
_dggrid = DGGRIDv7(executable=_dggrid_bin, working_dir="/tmp",
                   capture_logs=True, silent=True) if _dggrid_bin else None
Cell builders
For each grid system we build the geographic footprint (vertex lat/lon array) of a representative cell whose centroid is at a given latitude. Cells are densified along their edges so that curvature is preserved when reprojected.
def latlon_cell_vertices(lat_c, lon_c, dlat=5.0, dlon=5.0, n_edge=40):
    """5° lat-lon cell centred at (lat_c, lon_c)."""
    lat_s, lat_n = lat_c - dlat / 2, lat_c + dlat / 2
    lon_w, lon_e = lon_c - dlon / 2, lon_c + dlon / 2
    bottom = np.linspace(lon_w, lon_e, n_edge)
    right = np.linspace(lat_s, lat_n, n_edge)
    top = np.linspace(lon_e, lon_w, n_edge)
    left = np.linspace(lat_n, lat_s, n_edge)
    lats = np.r_[np.full(n_edge, lat_s), right, np.full(n_edge, lat_n), left]
    lons = np.r_[bottom, np.full(n_edge, lon_e), top, np.full(n_edge, lon_w)]
    return lats, lons


def behrmann_cell_vertices(lat_c, lon_c, equator_dlat=5.0, equator_dlon=5.0, n_edge=40):
    """Behrmann (cylindrical equal-area, std parallels ±30°) cell.

    Cell is constructed so that all cells have the SAME AREA as a
    `equator_dlat` × `equator_dlon` cell at the equator. Holding
    longitude width constant at `equator_dlon`, the latitude span at
    `lat_c` solves sin(φ_n) − sin(φ_s) = sin(equator_dlat/2)·2.
    """
    sin_half_target = np.sin(equator_dlat / 2 * DEG)
    # sin(φ_n) − sin(φ_s) = 2·cos(φ_c)·sin(δ/2)
    # → δ = 2·arcsin(sin_half_target / cos(φ_c))
    cos_c = np.cos(lat_c * DEG)
    arg = sin_half_target / cos_c
    if abs(arg) >= 1.0:
        # Cell would extend beyond the pole; clamp.
        arg = np.sign(arg) * 0.9999
    dlat = 2 * np.degrees(np.arcsin(arg))
    return latlon_cell_vertices(
        lat_c, lon_c, dlat=dlat, dlon=equator_dlon, n_edge=n_edge
    )


def healpix_cell_vertices(lat_c, lon_c, nside=16, n_edge=20):
    """HEALPix cell whose centre is closest to (lat_c, lon_c)."""
    theta = (90.0 - lat_c) * DEG
    phi = (lon_c % 360) * DEG
    pix = hp.ang2pix(nside, theta, phi, nest=True)
    # boundaries() returns 3xN cartesian; convert to lat/lon
    xyz = hp.boundaries(nside, pix, step=n_edge, nest=True)  # (3, 4*n_edge)
    x, y, z = xyz
    cell_lat = 90.0 - np.degrees(np.arccos(z))
    cell_lon = np.degrees(np.arctan2(y, x))
    return cell_lat, cell_lon


def healpix_geo_cell_vertices(lat_c, lon_c, depth=4):
    """HEALPix cell on the WGS84 ellipsoid (via healpix-geo / cdshealpix).

    `healpix-geo` implements the GRID4EARTH "Ellipsoidal HEALPix" path:
    HEALPix indexing whose cell vertices are computed on the WGS84
    ellipsoid via authalic-sphere mapping. depth=4 (nside=16) matches
    the HEALPix-on-sphere resolution used elsewhere in this notebook.
    """
    centre = hgn.lonlat_to_healpix(
        np.array([float(lon_c)]), np.array([float(lat_c)]),
        depth=depth, ellipsoid="WGS84",
    )
    lons_v, lats_v = hgn.vertices(
        centre.astype(np.uint64), depth=depth, ellipsoid="WGS84",
    )
    return np.asarray(lats_v[0]), np.asarray(lons_v[0])


def h3_cell_vertices(lat_c, lon_c, resolution=3):
    """H3 cell containing (lat_c, lon_c). Returns (lats, lons)."""
    cell = h3.latlng_to_cell(float(lat_c), float(lon_c), resolution)
    boundary = h3.cell_to_boundary(cell)  # tuple of (lat, lng)
    lats = np.array([b[0] for b in boundary])
    lons = np.array([b[1] for b in boundary])
    return lats, lons


def rhealpix_cell_vertices(lat_c, lon_c, resolution=4):
    """rHEALPix cell containing (lat_c, lon_c). Returns (lats, lons).

    NOTE: rhp_to_geo_boundary returns (lon, lat) — opposite order to H3.
    """
    cell = geo_to_rhp(float(lat_c), float(lon_c), resolution, plane=False)
    boundary = rhp_to_geo_boundary(cell, plane=False)
    lats = np.array([b[1] for b in boundary])
    lons = np.array([b[0] for b in boundary])
    return lats, lons


def isea3h_cell_vertices(lat_c, lon_c, resolution=8):
    """ISEA3H cell containing (lat_c, lon_c) (via dggrid4py)."""
    if _dggrid is None:
        raise RuntimeError(
            "DGGRID binary not found. Install conda-forge dggrid=8.41 "
            "or run inside the Docker container."
        )
    pt_gdf = gpd.GeoDataFrame(
        {"id": [0]},
        geometry=[Point(float(lon_c), float(lat_c))],
        crs="EPSG:4326",
    )
    cells_df = _dggrid.cells_for_geo_points(
        geodf_points_wgs84=pt_gdf, cell_ids_only=True,
        dggs_type="ISEA3H", resolution=resolution,
    )
    cell_id = int(cells_df["name"].iloc[0])
    poly_gdf = _dggrid.grid_cell_polygons_from_cellids(
        cell_id_list=[cell_id], dggs_type="ISEA3H", resolution=resolution,
        clip_subset_type="WHOLE_EARTH",
    )
    geom = poly_gdf.geometry.iloc[0]
    coords = list(geom.exterior.coords)  # (lon, lat) tuples
    lats = np.array([c[1] for c in coords])
    lons = np.array([c[0] for c in coords])
    return lats, lons


def _projected_square_cell_vertices(lat_c, lon_c, proj, cell_side_km=100,
                                    n_edge=40):
    """Square cell of side `cell_side_km` in projected space of `proj`,
    centred on the projection of (lat_c, lon_c). Returns (lats, lons).
    """
    side_m = cell_side_km * 1000.0
    half = side_m / 2.0
    xy = proj.transform_point(float(lon_c), float(lat_c), ccrs.PlateCarree())
    cx, cy = xy[0], xy[1]

    # Densify the square's edges in projected space
    s = np.linspace(-half, half, n_edge)
    bottom = [(cx + dx, cy - half) for dx in s]
    right = [(cx + half, cy + dy) for dy in s]
    top = [(cx + dx, cy + half) for dx in s[::-1]]
    left = [(cx - half, cy + dy) for dy in s[::-1]]
    xs = np.array([p[0] for p in bottom + right + top + left])
    ys = np.array([p[1] for p in bottom + right + top + left])

    # Unproject every vertex back to (lon, lat)
    pc = ccrs.PlateCarree()
    pts = pc.transform_points(proj, xs, ys)
    lons = pts[:, 0]
    lats = pts[:, 1]
    return lats, lons


def mollweide_cell_vertices(lat_c, lon_c, cell_side_km=100):
    """Mollweide-projected square cell of given side, unprojected to lat-lon."""
    return _projected_square_cell_vertices(
        lat_c, lon_c, ccrs.Mollweide(), cell_side_km=cell_side_km,
    )


def eea_cell_vertices(lat_c, lon_c, cell_side_km=100):
    """EEA reference grid (LAEA Europe / EPSG:3035) square cell."""
    eea_proj = ccrs.LambertAzimuthalEqualArea(
        central_longitude=10.0, central_latitude=52.0,
        false_easting=4_321_000.0, false_northing=3_210_000.0,
    )
    return _projected_square_cell_vertices(
        lat_c, lon_c, eea_proj, cell_side_km=cell_side_km,
    )
Aspect-ratio and area metrics
For each cell we compute its true geographic extent in km and report the aspect ratio (longest / shortest principal axis). Aspect ratio = 1 means a compact, square-ish neighborhood; aspect ratio = 6 means the cell is six times wider than tall.
def laea_xy(lats, lons, lat0, lon0):
    """Lambert azimuthal equal-area projection centred at (lat0, lon0)."""
    lat_r = lats * DEG
    lon_r = lons * DEG
    lat0_r = lat0 * DEG
    lon0_r = lon0 * DEG
    cosc = (np.sin(lat0_r) * np.sin(lat_r)
            + np.cos(lat0_r) * np.cos(lat_r) * np.cos(lon_r - lon0_r))
    k = np.sqrt(2 / (1 + cosc))
    x = R * k * np.cos(lat_r) * np.sin(lon_r - lon0_r)
    y = R * k * (np.cos(lat0_r) * np.sin(lat_r)
                 - np.sin(lat0_r) * np.cos(lat_r) * np.cos(lon_r - lon0_r))
    return x, y


def cell_metrics(lats, lons, lat_c, lon_c):
    """Width (km), height (km), aspect ratio, area (km²) via LAEA."""
    x, y = laea_xy(lats, lons, lat_c, lon_c)
    width = x.max() - x.min()
    height = y.max() - y.min()
    aspect = max(width, height) / min(width, height)
    # shoelace area
    area = 0.5 * abs(np.dot(x, np.roll(y, 1)) - np.dot(y, np.roll(x, 1)))
    return width, height, aspect, area
Build the figure
Three rows of latitudes × three columns of grids. Each tile is a Lambert azimuthal equal-area map centred on the cell, so the cell’s real geographic shape and km-scale extents are visible. The bottom panel plots aspect ratio vs latitude for the three grids over the full biodiversity-relevant range (0–70°N).
Everything is built in a single cell so the figure object stays alive end-to-end (the inline backend auto-closes figures between cells, which would leave the bottom strip detached).
LATITUDES_OF_INTEREST = [0.0, 40.0, 70.0]
NSIDE = 16

# Pre-compute everything for the upper panel grid
grid_specs = [
    ("Lat-lon 5° × 5°", "tab:red", latlon_cell_vertices),
    ("Behrmann (equal-area)", "tab:purple",
     lambda lc, loc: behrmann_cell_vertices(lc, loc)),
    (f"HEALPix DGGS (nside={NSIDE})", "tab:blue",
     lambda lc, loc: healpix_cell_vertices(lc, loc, nside=NSIDE)),
]

fig = plt.figure(figsize=(13, 12))
gs = fig.add_gridspec(
    4, 3, height_ratios=[1, 1, 1, 1.1], hspace=0.35, wspace=0.20
)

for row, lat_c in enumerate(LATITUDES_OF_INTEREST):
    for col, (name, color, builder) in enumerate(grid_specs):
        ax = fig.add_subplot(
            gs[row, col],
            projection=ccrs.LambertAzimuthalEqualArea(
                central_latitude=lat_c, central_longitude=0.0
            ),
        )
        # Choose a display window large enough for the worst (Behrmann
        # at 70°N) cell.
        half_extent_km = 1500e3
        ax.set_extent(
            [-half_extent_km, half_extent_km, -half_extent_km, half_extent_km],
            crs=ccrs.LambertAzimuthalEqualArea(
                central_latitude=lat_c, central_longitude=0.0
            ),
        )
        ax.coastlines(linewidth=0.4, color="0.55")
        ax.gridlines(linewidth=0.3, color="0.8", alpha=0.7)

        cell_lats, cell_lons = builder(lat_c, 0.0)
        ax.fill(
            cell_lons, cell_lats,
            transform=ccrs.PlateCarree(),
            facecolor=color, alpha=0.45, edgecolor=color, linewidth=1.5,
        )

        w_km, h_km, aspect, area_km2 = cell_metrics(
            cell_lats, cell_lons, lat_c, 0.0
        )
        if row == 0:
            ax.set_title(name, fontsize=11, fontweight="bold")

        ax.text(
            0.02, 0.98,
            f"lat = {lat_c:.0f}°N\n"
            f"{w_km:.0f} × {h_km:.0f} km\n"
            f"aspect = {aspect:.1f}\n"
            f"area = {area_km2/1000:.0f} × 10³ km²",
            transform=ax.transAxes,
            ha="left", va="top",
            fontsize=9,
            family="monospace",
            bbox=dict(facecolor="white", edgecolor="0.7",
                      boxstyle="round,pad=0.3", alpha=0.85),
        )

# --- Aspect ratio across all biodiversity-relevant latitudes ---
# Compares all seven grids in the same plot, grouped by family:
#   - Lat-lon (broken)
#   - Equal-area projections gridded in projected space (Behrmann, Mollweide, EEA)
#   - DGGS family (HEALPix, H3, rHEALPix, ISEA3H)
ax_bottom = fig.add_subplot(gs[3, :])
lat_grid = np.linspace(0, 70, 71)

# Lat-lon (cautionary baseline)
aspect_latlon = [
    cell_metrics(*latlon_cell_vertices(lat, 0.0), lat, 0.0)[2]
    for lat in lat_grid
]

# Projection-based equal-area grids
aspect_behrmann = [
    cell_metrics(*behrmann_cell_vertices(lat, 0.0), lat, 0.0)[2]
    for lat in lat_grid
]
aspect_mollweide = [
    cell_metrics(*mollweide_cell_vertices(lat, 0.0), lat, 0.0)[2]
    for lat in lat_grid
]
aspect_eea = [
    cell_metrics(*eea_cell_vertices(lat, 0.0), lat, 0.0)[2]
    for lat in lat_grid
]

# DGGS family
aspect_healpix = [
    cell_metrics(*healpix_cell_vertices(lat, 0.0, nside=NSIDE), lat, 0.0)[2]
    for lat in lat_grid
]
aspect_healpix_geo = [
    cell_metrics(*healpix_geo_cell_vertices(lat, 0.0, depth=4), lat, 0.0)[2]
    for lat in lat_grid
]
aspect_h3 = [
    cell_metrics(*h3_cell_vertices(lat, 0.0), lat, 0.0)[2]
    for lat in lat_grid
]
aspect_rhealpix = [
    cell_metrics(*rhealpix_cell_vertices(lat, 0.0), lat, 0.0)[2]
    for lat in lat_grid
]
aspect_isea3h = [
    cell_metrics(*isea3h_cell_vertices(lat, 0.0), lat, 0.0)[2]
    for lat in lat_grid
]

# Tier 1 (broken)
ax_bottom.plot(lat_grid, aspect_latlon, color="tab:red", lw=2.2,
               label="Lat-lon 5° (broken: not equal-area, not compact)")

# Tier 2 (equal-area projections, gridded in projected space)
ax_bottom.plot(lat_grid, aspect_behrmann, color="tab:purple", lw=1.6,
               label="Behrmann (equal-area projection)")
ax_bottom.plot(lat_grid, aspect_mollweide, color="indigo", lw=1.6,
               linestyle="--",
               label="Mollweide (equal-area projection)")
ax_bottom.plot(lat_grid, aspect_eea, color="orchid", lw=1.6, linestyle=":",
               label="EEA reference grid (LAEA Europe)")

# Tier 3 (DGGS family — preserves shape)
ax_bottom.plot(lat_grid, aspect_healpix, color="tab:blue", lw=2.0,
               label=f"HEALPix nside={NSIDE} (DGGS, sphere)")
ax_bottom.plot(lat_grid, aspect_healpix_geo, color="royalblue", lw=1.6,
               linestyle="--",
               label=f"HEALPix-geo nside={NSIDE} (DGGS, WGS84 — GRID4EARTH)")
ax_bottom.plot(lat_grid, aspect_h3, color="tab:cyan", lw=1.6, linestyle="--",
               label="H3 res 3 (DGGS, hexagonal)")
ax_bottom.plot(lat_grid, aspect_rhealpix, color="teal", lw=1.6, linestyle=":",
               label="rHEALPix res 4 (DGGS, WGS84 cube-projected)")
ax_bottom.plot(lat_grid, aspect_isea3h, color="seagreen", lw=1.6, linestyle="-.",
               label="ISEA3H res 8 (DGGS, hex icosahedral)")

ax_bottom.axhline(1.0, color="0.5", linestyle=":", linewidth=0.8)
ax_bottom.set_xlabel("Latitude (°N)")
ax_bottom.set_ylabel("Cell aspect ratio (longer / shorter axis)")
ax_bottom.set_xlim(0, 70)
ax_bottom.set_ylim(
    0.9,
    max(aspect_latlon + aspect_behrmann + aspect_mollweide + aspect_eea) * 1.05,
)
ax_bottom.legend(loc="upper left", fontsize=8, framealpha=0.95, ncol=2)
ax_bottom.set_title(
    "Cell aspect ratio across biodiversity-relevant latitudes — "
    "DGGS family stays compact, projection family distorts",
    fontsize=11,
)

fig.suptitle(
    "Equal-area is necessary but not sufficient for AI-ready biodiversity grids",
    fontsize=14, fontweight="bold", y=0.995,
)

plt.savefig("../images/grid_anisotropy.png", dpi=150, bbox_inches="tight")
plt.show()
/home/runner/micromamba/envs/dggs-biodiversity-bias/lib/python3.11/site-packages/pyogrio/raw.py:198: RuntimeWarning: driver FlatGeobuf does not support open option DRIVER
return ogr_read(
/home/runner/micromamba/envs/dggs-biodiversity-bias/lib/python3.11/site-packages/pyogrio/raw.py:198: RuntimeWarning: driver FlatGeobuf does not support open option DRIVER
  return ogr_read(
/home/runner/micromamba/envs/dggs-biodiversity-bias/lib/python3.11/site-packages/pyogrio/raw.py:198: RuntimeWarning: driver FlatGeobuf does not support open option DRIVER
  return ogr_read(
/home/runner/micromamba/envs/dggs-biodiversity-bias/lib/python3.11/site-packages/pyogrio/raw.py:198: RuntimeWarning: driver FlatGeobuf does not support open option DRIVER
  return ogr_read(
/home/runner/micromamba/envs/dggs-biodiversity-bias/lib/python3.11/site-packages/pyogrio/raw.py:198: RuntimeWarning: driver FlatGeobuf does not support open option DRIVER
  return ogr_read(
/home/runner/micromamba/envs/dggs-biodiversity-bias/lib/python3.11/site-packages/pyogrio/raw.py:198: RuntimeWarning: driver FlatGeobuf does not support open option DRIVER
  return ogr_read(
/home/runner/micromamba/envs/dggs-biodiversity-bias/lib/python3.11/site-packages/pyogrio/raw.py:198: RuntimeWarning: driver FlatGeobuf does not support open option DRIVER
  return ogr_read(
/home/runner/micromamba/envs/dggs-biodiversity-bias/lib/python3.11/site-packages/pyogrio/raw.py:198: RuntimeWarning: driver FlatGeobuf does not support open option DRIVER
  return ogr_read(
/home/runner/micromamba/envs/dggs-biodiversity-bias/lib/python3.11/site-packages/pyogrio/raw.py:198: RuntimeWarning: driver FlatGeobuf does not support open option DRIVER
  return ogr_read(
/home/runner/micromamba/envs/dggs-biodiversity-bias/lib/python3.11/site-packages/pyogrio/raw.py:198: RuntimeWarning: driver FlatGeobuf does not support open option DRIVER
  return ogr_read(
/home/runner/micromamba/envs/dggs-biodiversity-bias/lib/python3.11/site-packages/pyogrio/raw.py:198: RuntimeWarning: driver FlatGeobuf does not support open option DRIVER
  return ogr_read(
/home/runner/micromamba/envs/dggs-biodiversity-bias/lib/python3.11/site-packages/pyogrio/raw.py:198: RuntimeWarning: driver FlatGeobuf does not support open option DRIVER
  return ogr_read(
/home/runner/micromamba/envs/dggs-biodiversity-bias/lib/python3.11/site-packages/pyogrio/raw.py:198: RuntimeWarning: driver FlatGeobuf does not support open option DRIVER
  return ogr_read(
/home/runner/micromamba/envs/dggs-biodiversity-bias/lib/python3.11/site-packages/pyogrio/raw.py:198: RuntimeWarning: driver FlatGeobuf does not support open option DRIVER
  return ogr_read(
/home/runner/micromamba/envs/dggs-biodiversity-bias/lib/python3.11/site-packages/pyogrio/raw.py:198: RuntimeWarning: driver FlatGeobuf does not support open option DRIVER
  return ogr_read(
/home/runner/micromamba/envs/dggs-biodiversity-bias/lib/python3.11/site-packages/pyogrio/raw.py:198: RuntimeWarning: driver FlatGeobuf does not support open option DRIVER
  return ogr_read(
/home/runner/micromamba/envs/dggs-biodiversity-bias/lib/python3.11/site-packages/pyogrio/raw.py:198: RuntimeWarning: driver FlatGeobuf does not support open option DRIVER
  return ogr_read(
/home/runner/micromamba/envs/dggs-biodiversity-bias/lib/python3.11/site-packages/pyogrio/raw.py:198: RuntimeWarning: driver FlatGeobuf does not support open option DRIVER
  return ogr_read(
/home/runner/micromamba/envs/dggs-biodiversity-bias/lib/python3.11/site-packages/pyogrio/raw.py:198: RuntimeWarning: driver FlatGeobuf does not support open option DRIVER
  return ogr_read(
/home/runner/micromamba/envs/dggs-biodiversity-bias/lib/python3.11/site-packages/pyogrio/raw.py:198: RuntimeWarning: driver FlatGeobuf does not support open option DRIVER
  return ogr_read(
/home/runner/micromamba/envs/dggs-biodiversity-bias/lib/python3.11/site-packages/pyogrio/raw.py:198: RuntimeWarning: driver FlatGeobuf does not support open option DRIVER
  return ogr_read(
/home/runner/micromamba/envs/dggs-biodiversity-bias/lib/python3.11/site-packages/pyogrio/raw.py:198: RuntimeWarning: driver FlatGeobuf does not support open option DRIVER
  return ogr_read(
/home/runner/micromamba/envs/dggs-biodiversity-bias/lib/python3.11/site-packages/pyogrio/raw.py:198: RuntimeWarning: driver FlatGeobuf does not support open option DRIVER
  return ogr_read(
/home/runner/micromamba/envs/dggs-biodiversity-bias/lib/python3.11/site-packages/pyogrio/raw.py:198: RuntimeWarning: driver FlatGeobuf does not support open option DRIVER
  return ogr_read(
/home/runner/micromamba/envs/dggs-biodiversity-bias/lib/python3.11/site-packages/pyogrio/raw.py:198: RuntimeWarning: driver FlatGeobuf does not support open option DRIVER
  return ogr_read(
/home/runner/micromamba/envs/dggs-biodiversity-bias/lib/python3.11/site-packages/pyogrio/raw.py:198: RuntimeWarning: driver FlatGeobuf does not support open option DRIVER
  return ogr_read(
/home/runner/micromamba/envs/dggs-biodiversity-bias/lib/python3.11/site-packages/pyogrio/raw.py:198: RuntimeWarning: driver FlatGeobuf does not support open option DRIVER
  return ogr_read(
/home/runner/micromamba/envs/dggs-biodiversity-bias/lib/python3.11/site-packages/pyogrio/raw.py:198: RuntimeWarning: driver FlatGeobuf does not support open option DRIVER
  return ogr_read(
/home/runner/micromamba/envs/dggs-biodiversity-bias/lib/python3.11/site-packages/pyogrio/raw.py:198: RuntimeWarning: driver FlatGeobuf does not support open option DRIVER
  return ogr_read(
/home/runner/micromamba/envs/dggs-biodiversity-bias/lib/python3.11/site-packages/pyogrio/raw.py:198: RuntimeWarning: driver FlatGeobuf does not support open option DRIVER
  return ogr_read(
/home/runner/micromamba/envs/dggs-biodiversity-bias/lib/python3.11/site-packages/pyogrio/raw.py:198: RuntimeWarning: driver FlatGeobuf does not support open option DRIVER
  return ogr_read(
/home/runner/micromamba/envs/dggs-biodiversity-bias/lib/python3.11/site-packages/pyogrio/raw.py:198: RuntimeWarning: driver FlatGeobuf does not support open option DRIVER
  return ogr_read(
/home/runner/micromamba/envs/dggs-biodiversity-bias/lib/python3.11/site-packages/pyogrio/raw.py:198: RuntimeWarning: driver FlatGeobuf does not support open option DRIVER
  return ogr_read(
/home/runner/micromamba/envs/dggs-biodiversity-bias/lib/python3.11/site-packages/pyogrio/raw.py:198: RuntimeWarning: driver FlatGeobuf does not support open option DRIVER
  return ogr_read(
/home/runner/micromamba/envs/dggs-biodiversity-bias/lib/python3.11/site-packages/pyogrio/raw.py:198: RuntimeWarning: driver FlatGeobuf does not support open option DRIVER
  return ogr_read(
/home/runner/micromamba/envs/dggs-biodiversity-bias/lib/python3.11/site-packages/pyogrio/raw.py:198: RuntimeWarning: driver FlatGeobuf does not support open option DRIVER
  return ogr_read(
/home/runner/micromamba/envs/dggs-biodiversity-bias/lib/python3.11/site-packages/pyogrio/raw.py:198: RuntimeWarning: driver FlatGeobuf does not support open option DRIVER
  return ogr_read(
/home/runner/micromamba/envs/dggs-biodiversity-bias/lib/python3.11/site-packages/pyogrio/raw.py:198: RuntimeWarning: driver FlatGeobuf does not support open option DRIVER
  return ogr_read(
/home/runner/micromamba/envs/dggs-biodiversity-bias/lib/python3.11/site-packages/pyogrio/raw.py:198: RuntimeWarning: driver FlatGeobuf does not support open option DRIVER
  return ogr_read(
/home/runner/micromamba/envs/dggs-biodiversity-bias/lib/python3.11/site-packages/pyogrio/raw.py:198: RuntimeWarning: driver FlatGeobuf does not support open option DRIVER
  return ogr_read(
/home/runner/micromamba/envs/dggs-biodiversity-bias/lib/python3.11/site-packages/pyogrio/raw.py:198: RuntimeWarning: driver FlatGeobuf does not support open option DRIVER
  return ogr_read(
/home/runner/micromamba/envs/dggs-biodiversity-bias/lib/python3.11/site-packages/pyogrio/raw.py:198: RuntimeWarning: driver FlatGeobuf does not support open option DRIVER
  return ogr_read(
/home/runner/micromamba/envs/dggs-biodiversity-bias/lib/python3.11/site-packages/pyogrio/raw.py:198: RuntimeWarning: driver FlatGeobuf does not support open option DRIVER
  return ogr_read(
/home/runner/micromamba/envs/dggs-biodiversity-bias/lib/python3.11/site-packages/pyogrio/raw.py:198: RuntimeWarning: driver FlatGeobuf does not support open option DRIVER
  return ogr_read(
/home/runner/micromamba/envs/dggs-biodiversity-bias/lib/python3.11/site-packages/pyogrio/raw.py:198: RuntimeWarning: driver FlatGeobuf does not support open option DRIVER
  return ogr_read(
/home/runner/micromamba/envs/dggs-biodiversity-bias/lib/python3.11/site-packages/pyogrio/raw.py:198: RuntimeWarning: driver FlatGeobuf does not support open option DRIVER
  return ogr_read(
/home/runner/micromamba/envs/dggs-biodiversity-bias/lib/python3.11/site-packages/pyogrio/raw.py:198: RuntimeWarning: driver FlatGeobuf does not support open option DRIVER
  return ogr_read(
/home/runner/micromamba/envs/dggs-biodiversity-bias/lib/python3.11/site-packages/pyogrio/raw.py:198: RuntimeWarning: driver FlatGeobuf does not support open option DRIVER
  return ogr_read(
/home/runner/micromamba/envs/dggs-biodiversity-bias/lib/python3.11/site-packages/pyogrio/raw.py:198: RuntimeWarning: driver FlatGeobuf does not support open option DRIVER
  return ogr_read(
/home/runner/micromamba/envs/dggs-biodiversity-bias/lib/python3.11/site-packages/pyogrio/raw.py:198: RuntimeWarning: driver FlatGeobuf does not support open option DRIVER
  return ogr_read(
/home/runner/micromamba/envs/dggs-biodiversity-bias/lib/python3.11/site-packages/pyogrio/raw.py:198: RuntimeWarning: driver FlatGeobuf does not support open option DRIVER
  return ogr_read(
/home/runner/micromamba/envs/dggs-biodiversity-bias/lib/python3.11/site-packages/pyogrio/raw.py:198: RuntimeWarning: driver FlatGeobuf does not support open option DRIVER
  return ogr_read(
/home/runner/micromamba/envs/dggs-biodiversity-bias/lib/python3.11/site-packages/pyogrio/raw.py:198: RuntimeWarning: driver FlatGeobuf does not support open option DRIVER
  return ogr_read(
/home/runner/micromamba/envs/dggs-biodiversity-bias/lib/python3.11/site-packages/pyogrio/raw.py:198: RuntimeWarning: driver FlatGeobuf does not support open option DRIVER
  return ogr_read(
/home/runner/micromamba/envs/dggs-biodiversity-bias/lib/python3.11/site-packages/pyogrio/raw.py:198: RuntimeWarning: driver FlatGeobuf does not support open option DRIVER
  return ogr_read(
/home/runner/micromamba/envs/dggs-biodiversity-bias/lib/python3.11/site-packages/pyogrio/raw.py:198: RuntimeWarning: driver FlatGeobuf does not support open option DRIVER
  return ogr_read(
/home/runner/micromamba/envs/dggs-biodiversity-bias/lib/python3.11/site-packages/pyogrio/raw.py:198: RuntimeWarning: driver FlatGeobuf does not support open option DRIVER
  return ogr_read(
/home/runner/micromamba/envs/dggs-biodiversity-bias/lib/python3.11/site-packages/pyogrio/raw.py:198: RuntimeWarning: driver FlatGeobuf does not support open option DRIVER
  return ogr_read(
/home/runner/micromamba/envs/dggs-biodiversity-bias/lib/python3.11/site-packages/pyogrio/raw.py:198: RuntimeWarning: driver FlatGeobuf does not support open option DRIVER
  return ogr_read(
/home/runner/micromamba/envs/dggs-biodiversity-bias/lib/python3.11/site-packages/pyogrio/raw.py:198: RuntimeWarning: driver FlatGeobuf does not support open option DRIVER
  return ogr_read(
/home/runner/micromamba/envs/dggs-biodiversity-bias/lib/python3.11/site-packages/pyogrio/raw.py:198: RuntimeWarning: driver FlatGeobuf does not support open option DRIVER
  return ogr_read(
/home/runner/micromamba/envs/dggs-biodiversity-bias/lib/python3.11/site-packages/pyogrio/raw.py:198: RuntimeWarning: driver FlatGeobuf does not support open option DRIVER
  return ogr_read(
/home/runner/micromamba/envs/dggs-biodiversity-bias/lib/python3.11/site-packages/pyogrio/raw.py:198: RuntimeWarning: driver FlatGeobuf does not support open option DRIVER
  return ogr_read(
/home/runner/micromamba/envs/dggs-biodiversity-bias/lib/python3.11/site-packages/pyogrio/raw.py:198: RuntimeWarning: driver FlatGeobuf does not support open option DRIVER
  return ogr_read(
/home/runner/micromamba/envs/dggs-biodiversity-bias/lib/python3.11/site-packages/pyogrio/raw.py:198: RuntimeWarning: driver FlatGeobuf does not support open option DRIVER
  return ogr_read(
/home/runner/micromamba/envs/dggs-biodiversity-bias/lib/python3.11/site-packages/pyogrio/raw.py:198: RuntimeWarning: driver FlatGeobuf does not support open option DRIVER
  return ogr_read(
/home/runner/micromamba/envs/dggs-biodiversity-bias/lib/python3.11/site-packages/pyogrio/raw.py:198: RuntimeWarning: driver FlatGeobuf does not support open option DRIVER
  return ogr_read(
/home/runner/micromamba/envs/dggs-biodiversity-bias/lib/python3.11/site-packages/pyogrio/raw.py:198: RuntimeWarning: driver FlatGeobuf does not support open option DRIVER
  return ogr_read(
/home/runner/micromamba/envs/dggs-biodiversity-bias/lib/python3.11/site-packages/pyogrio/raw.py:198: RuntimeWarning: driver FlatGeobuf does not support open option DRIVER
  return ogr_read(
/home/runner/micromamba/envs/dggs-biodiversity-bias/lib/python3.11/site-packages/pyogrio/raw.py:198: RuntimeWarning: driver FlatGeobuf does not support open option DRIVER
return ogr_read(
/home/runner/micromamba/envs/dggs-biodiversity-bias/lib/python3.11/site-packages/pyogrio/raw.py:198: RuntimeWarning: driver FlatGeobuf does not support open option DRIVER
return ogr_read(
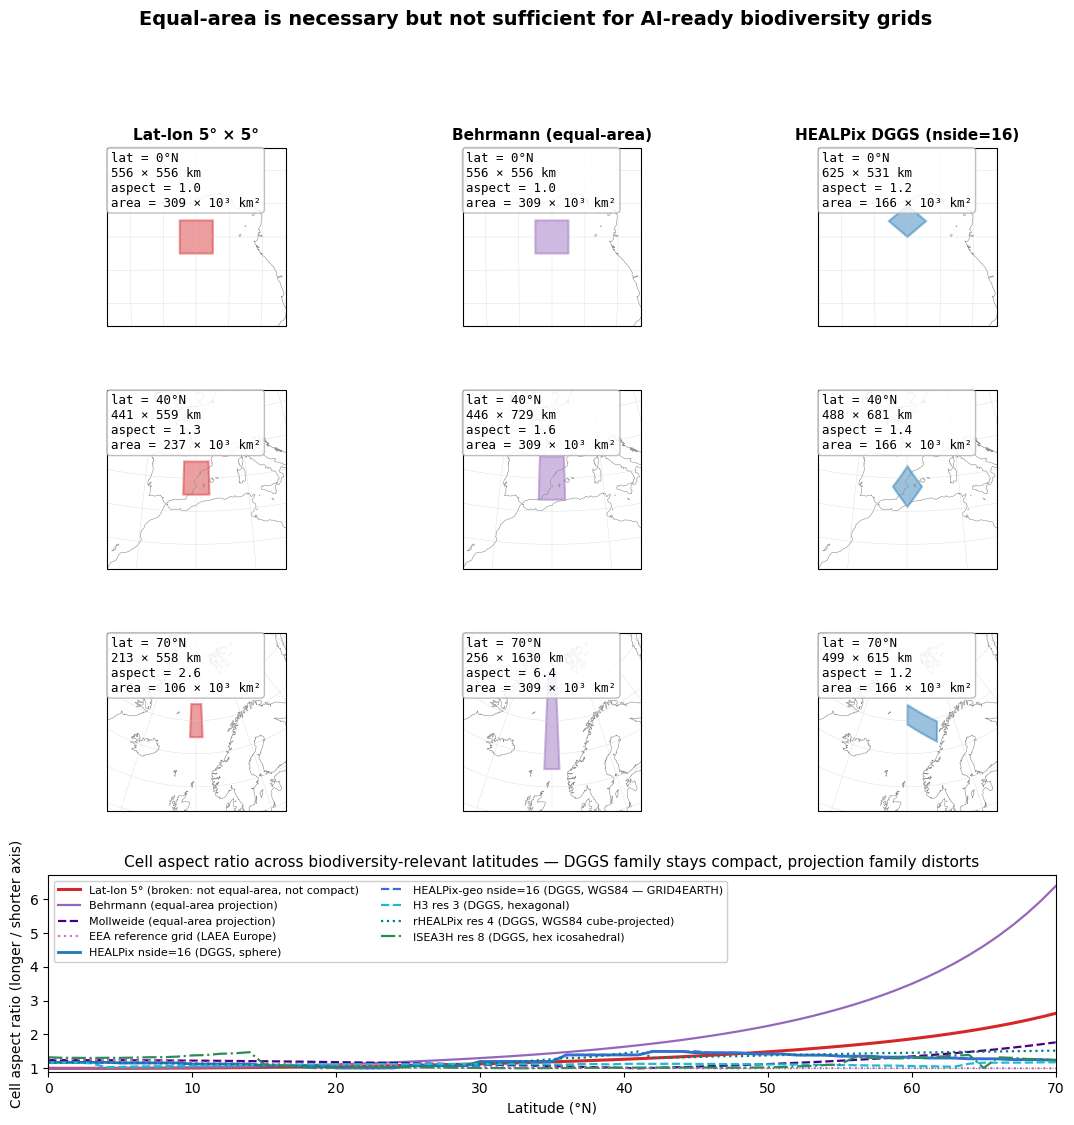
What the figure shows
Top three rows. A single cell from each grid system, drawn on a Lambert azimuthal equal-area map centred on the cell. At the equator all three look reasonable. By 40°N the lat-lon cell is already narrower east-west than it is tall, while the Behrmann cell is starting to stretch the other way (wider than tall). At 70°N the anisotropy is dramatic for both rectilinear grids; HEALPix remains compact.
Bottom strip. Aspect ratio (longer axis / shorter axis) as a function of latitude. The dotted line at 1.0 is “perfectly compact.” HEALPix stays close to 1 across the entire 0–70°N band. Lat-lon diverges upward as longitude lines converge. Behrmann diverges upward in the opposite direction — its cells become wider than tall to keep area constant.
The slide-5 takeaway. For mapping and visual presentation, Behrmann or Mollweide are perfectly defensible — they preserve area, which is what global biodiversity counts need. But for machine-actionable workflows — convolutional models, multi- resolution analysis, cloud-native chunked storage — equal-area is necessary but not sufficient. The cell must also be compact (so CNN kernels see consistent neighbourhoods) and hierarchically refinable (so resolution can change without re-projection). HEALPix and other modern DGGSs are designed for both.