Introduction
Overview
Teaching: 30 min
Exercises: 30 minQuestions
What is jupyterlab?
How to use jupyterlab?
How to start and run simple python jupyter notebooks?
Objectives
Get familiar with jupyterlab
Run a simple jupyter notebook with python kernel
What is Jupyterlab?
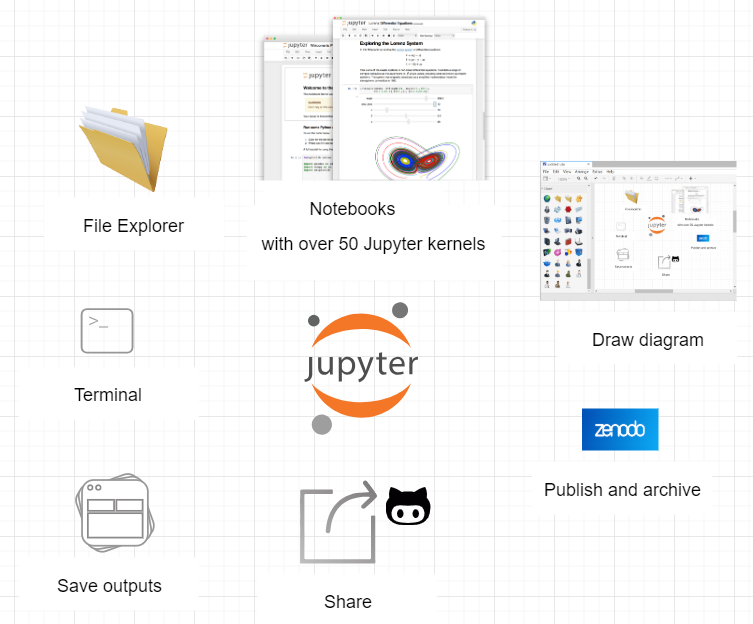
JupyterLab is the next-generation web-based user interface for Project Jupyter. It is made of modular building blocks:
- File explorer
- Text editor
- Diagram generator
- jupyter notebooks supporting more than 50 different Jupyter kernels
- Terminals
- Outputs
with an easy integration with Jupyterlab extension such as jupyterlab-latex for live-editing of LaTeX documents, jupyterlab-git for git integration or jupyterlab-drawio for creating diagrams.
See JupyterLab slides from JupyterLab Github demo repository for more information about JupyterLab.
Get familiar with Jupyterlab
Follow setup instructions and start jupyterlab from anaconda-navigator:
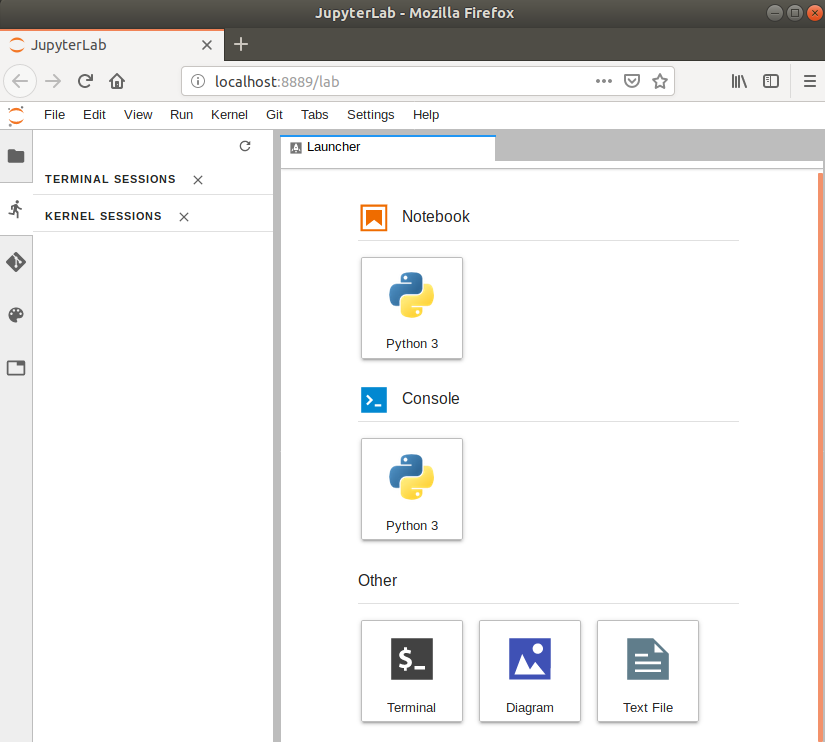
Create a new python 3 jupyter notebook
- Create a new python 3 jupyter notebook
from skimage import io
import matplotlib.pyplot as plt
%matplotlib inline

# https://directory.eoportal.org/web/eoportal/satellite-missions/c-missions/copernicus-sentinel-2
url="https://directory.eoportal.org/documents/163813/4091221/Sentinel2_Auto98.jpeg"
image = io.imread(url)
plt.imshow(image)
plt.title("Peruvian mountain scene, 14 July 2017, Sentinel-2\n (credit: ESA, processed by ESA, CC BY-SA 3.0 IGO)")
plt.show()
- Rename your notebook to
example.ipynb- Add a markdown cell
# Using equation with LaTeX notation in a markdown cell

The well known Pythagorean theorem $x^2 + y^2 = z^2$ was
proved to be invalid for other exponents.
Meaning the next equation has no integer solutions:

\begin{equation}
 x^n + y^n = z^n
\end{equation}
- Add a simple plot (see matplotlib gallery for examples)
import matplotlib
import matplotlib.pyplot as plt
import numpy as np

# Data for plotting
t = np.arange(0.0, 2.0, 0.01)
s = 1 + np.sin(2 * np.pi * t)

fig, ax = plt.subplots()
ax.plot(t, s)

ax.set(xlabel='time (s)', ylabel='voltage (mV)',
       title='About as simple as it gets, folks')
ax.grid()

fig.savefig("test.png")
plt.show()
Example above is taken from https://matplotlib.org/gallery/lines_bars_and_markers/simple_plot.html).
You can also add your own notebooks and try them out. Please note that some python packages may not be available in the provided environment.
You can get the list of available packages with the following command:
!conda list
Key Points
jupyterlab
jupyter notebook