Convert EarthCARE atmospheric profile data (ATLID lidar, CPR radar) to HEALPix.
Profile data is fundamentally different from 2D swath imagery:
1D lat/lon along the ground track
A vertical dimension (height) with atmospheric columns
Each profile is mapped to a HEALPix cell, the vertical axis is preserved
import earthcarekit as eck
import healpix_geo as hpxg
import matplotlib.pyplot as plt
import numpy as np
import xarray as xr

import cartopy.crs as ccrs
import cartopy.feature as cfeature

from earthcare_dggs.convert import lonlat_to_healpix_cells
from earthcare_dggs.settings import ATLID_DEPTH, ELLIPSOID

ORBIT = "06109D"
Load ATLID product
result = eck.search_product(file_type="ATL_AER_2A", orbit_and_frame=ORBIT)
with eck.read_product(result.filepath[0]) as ds:
    atl = ds.load()

print(f"Dimensions: {dict(atl.sizes)}")
print(f"Lat: [{float(atl['latitude'].min()):.1f}, {float(atl['latitude'].max()):.1f}]")
print(f"Lon: [{float(atl['longitude'].min()):.1f}, {float(atl['longitude'].max()):.1f}]")
print(f"\n2D variables (along_track, vertical):")
for v in atl.data_vars:
    if atl[v].dims == ("along_track", "vertical"):
        print(f"  {v}: shape={atl[v].shape}")
Dimensions: {'along_track': 5144, 'vertical': 242, 'layer': 25, 'class': 7}
Lat: [22.5, 67.5]
Lon: [-0.6, 16.7]
2D variables (along_track, vertical):
height: shape=(5144, 242)
range: shape=(5144, 242)
simple_classification: shape=(5144, 242)
mie_detection_status: shape=(5144, 242)
rayleigh_detection_status: shape=(5144, 242)
horizontal_averaging_mask: shape=(5144, 242)
internal_lidar_feature_mask: shape=(5144, 242)
extended_data_quality_status: shape=(5144, 242)
quality_status: shape=(5144, 242)
particle_extinction_coefficient_355nm: shape=(5144, 242)
particle_extinction_coefficient_355nm_error: shape=(5144, 242)
particle_backscatter_coefficient_355nm: shape=(5144, 242)
particle_backscatter_coefficient_355nm_error: shape=(5144, 242)
particle_linear_depol_ratio_355nm: shape=(5144, 242)
particle_linear_depol_ratio_355nm_error: shape=(5144, 242)
lidar_ratio_355nm: shape=(5144, 242)
lidar_ratio_355nm_error: shape=(5144, 242)
particle_effective_area_radius: shape=(5144, 242)
multiple_scattering_eta_o_parameter: shape=(5144, 242)
multiple_scattering_mie_f_fac_parameter: shape=(5144, 242)
classification: shape=(5144, 242)
aerosol_classification: shape=(5144, 242)
aerosol_classification_no_error: shape=(5144, 242)
Assign HEALPix cell IDs
For profile data, we assign each along-track position to its HEALPix cell
and add cell_ids as a coordinate. The vertical dimension is preserved as-is.
prof_cell_ids = lonlat_to_healpix_cells(
    atl["longitude"].values, atl["latitude"].values,
    depth=ATLID_DEPTH, ellipsoid=ELLIPSOID,
)

unique_cells = np.unique(prof_cell_ids)
print(f"HEALPix depth {ATLID_DEPTH}: {len(atl.along_track)} profiles → {len(unique_cells)} unique cells")
print(f"Average profiles per cell: {len(atl.along_track) / len(unique_cells):.1f}")

# Add cell_ids as coordinate
atl_healpix = atl.assign_coords(cell_ids=("along_track", prof_cell_ids))
atl_healpix.attrs.update({
    "healpix_level": ATLID_DEPTH,
    "healpix_indexing": "nested",
    "healpix_ellipsoid": ELLIPSOID,
})

print(f"\nDataset with cell_ids coordinate:")
print(atl_healpix)
HEALPix depth 14: 5144 profiles → 5144 unique cells
Average profiles per cell: 1.0
Dataset with cell_ids coordinate:
<xarray.Dataset> Size: 100MB
Dimensions: (along_track: 5144,
vertical: 242, layer: 25,
class: 7)
Coordinates:
cell_ids (along_track) uint64 41kB 2...
Dimensions without coordinates: along_track, vertical, layer, class
Data variables: (12/48)
filename <U60 240B 'ECA_EXBA_ATL_AER...
file_type <U10 40B 'ATL_AER_2A'
frame_id <U1 4B 'D'
orbit_number int64 8B 6109
orbit_and_frame <U6 24B '06109D'
baseline <U2 8B 'BA'
... ...
classification (along_track, vertical) int8 1MB ...
aerosol_classification (along_track, vertical) int8 1MB ...
aerosol_classification_no_error (along_track, vertical) int8 1MB ...
aerosol_classes (class) |S32 224B b' 1: Du...
aerosol_classification_prob (along_track, vertical, class) int8 9MB ...
aerosol_classification_prob_no_errors (along_track, vertical, class) int8 9MB ...
Attributes:
healpix_level: 14
healpix_indexing: nested
healpix_ellipsoid: WGS84
Visualize
fig, axes = plt.subplots(1, 2, figsize=(16, 6),
                         subplot_kw={"projection": ccrs.PlateCarree()},
                         gridspec_kw={"width_ratios": [1, 1]})

# Ground track colored by HEALPix cell
ax = axes[0]
ax.add_feature(cfeature.COASTLINE, linewidth=0.5)
ax.add_feature(cfeature.BORDERS, linewidth=0.3)
ax.gridlines(draw_labels=True, linewidth=0.3)
sc = ax.scatter(
    atl["longitude"].values, atl["latitude"].values,
    c=prof_cell_ids, s=1, cmap="tab20",
    transform=ccrs.PlateCarree(),
)
ax.set_title(f"ATLID ground track — HEALPix depth {ATLID_DEPTH}")
ax.set_extent([
    float(atl.longitude.min()) - 2, float(atl.longitude.max()) + 2,
    float(atl.latitude.min()) - 2, float(atl.latitude.max()) + 2,
], crs=ccrs.PlateCarree())

# Curtain plot — find first 2D variable
ax = axes[1]
plot_var = None
for v in atl.data_vars:
    if atl[v].dims == ("along_track", "vertical") and v not in ("height", "range"):
        plot_var = v
        break

if plot_var and "height" in atl:
    data = atl[plot_var].values
    height = atl["height"].values / 1000  # km
    step = max(1, data.shape[0] // 500)
    im = ax.pcolormesh(
        np.arange(0, data.shape[0], step),
        height[::step, :].T,
        data[::step, :].T,
        shading="nearest", cmap="viridis",
    )
    ax.set_xlabel("Along-track index")
    ax.set_ylabel("Height (km)")
    ax.set_title(f"ATLID {plot_var} (curtain)")
    plt.colorbar(im, ax=ax, shrink=0.7)

plt.tight_layout()
plt.show()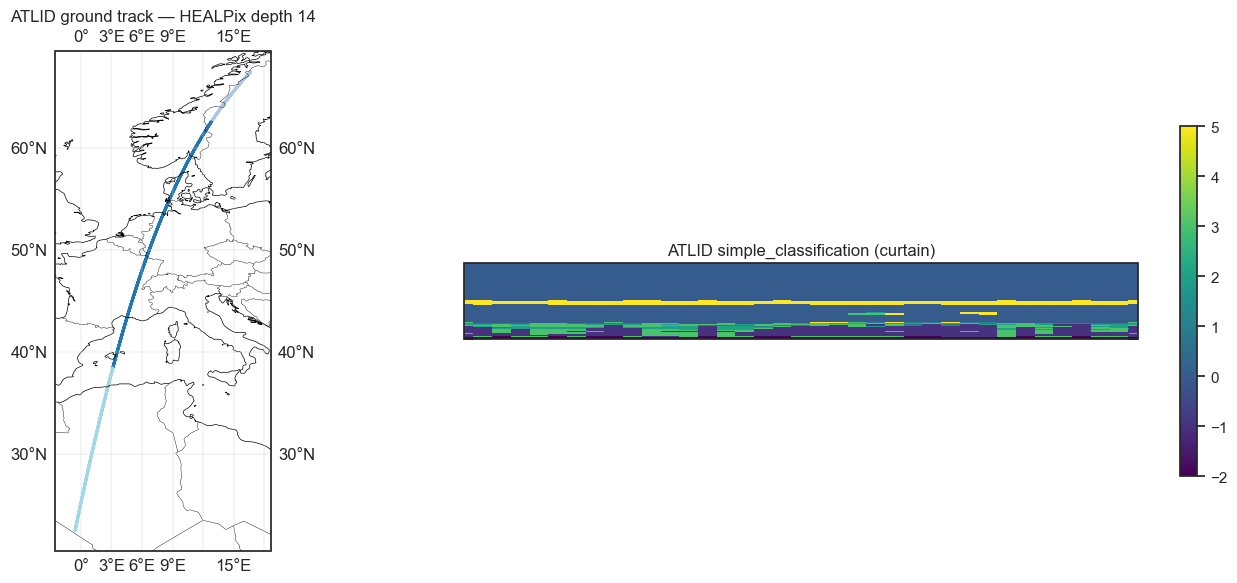
Groupby cell for aggregation
With cell_ids as a coordinate, you can easily aggregate profiles per cell
using xarray’s groupby.
# Example: compute mean profile per HEALPix cell
if plot_var:
    cell_mean = atl_healpix[plot_var].groupby("cell_ids").mean()
    print(f"Mean {plot_var} per cell: {cell_mean}")
Mean simple_classification per cell: <xarray.DataArray 'simple_classification' (cell_ids: 5144, vertical: 242)> Size: 10MB
array([[ 0., 0., 0., ..., -2., -2., -2.],
[ 0., 0., 0., ..., -2., -2., -2.],
[ 0., 0., 0., ..., -2., -2., -2.],
...,
[ 0., 0., 0., ..., -2., -2., -2.],
[ 0., 0., 0., ..., -2., -2., -2.],
[ 0., 0., 0., ..., -2., -2., -2.]], shape=(5144, 242))
Coordinates:
* cell_ids (cell_ids) uint64 41kB 176849026 176849036 ... 1340069332
Dimensions without coordinates: vertical
Attributes:
units: 1
long_name: Simple Classification
comment: Simple Classification (used as backup if A-TC class if unknown)
definition: -3: Missing data \n\t-2: Surface \n\t-1: BOTH Mie and Ray At...