Convert EarthCARE MSI Level 2 products (2D swath data) to HEALPix DGGS format.
This notebook demonstrates:
Converting classification variables with mode aggregation
Converting continuous variables with mean aggregation
Converting error variables with RMS aggregation
Interactive visualization with
xdggs.explore()
import earthcarekit as eck
import healpix_geo as hpxg
import matplotlib.pyplot as plt
import numpy as np
import xarray as xr
import xdggs

from earthcare_dggs.convert import convert_msi_to_healpix
from earthcare_dggs.settings import ELLIPSOID, MSI_DEPTH, MSI_VARIABLES

ORBIT = "06109D"
Load MSI products
products = {}
for file_type in ["MSI_CM__2A", "MSI_COP_2A", "MSI_AOT_2A"]:
    try:
        result = eck.search_product(file_type=file_type, orbit_and_frame=ORBIT)
        with eck.read_product(result.filepath[0]) as ds:
            products[file_type] = ds.load()
        print(f"{file_type}: loaded")
    except Exception as e:
        print(f"{file_type}: not available ({e})")

msi_cm = products["MSI_CM__2A"]
print(f"\nOrbit: {msi_cm['orbit_and_frame'].values}")
print(f"Lat: [{float(msi_cm['latitude_swath'].min()):.1f}, {float(msi_cm['latitude_swath'].max()):.1f}]")
print(f"Lon: [{float(msi_cm['longitude_swath'].min()):.1f}, {float(msi_cm['longitude_swath'].max()):.1f}]")
MSI_CM__2A: loaded
MSI_COP_2A: loaded
MSI_AOT_2A: loaded
Orbit: 06109D
Lat: [22.3, 67.6]
Lon: [-0.9, 19.3]
Convert to HEALPix
Using the conversion settings from earthcare_dggs.settings, each variable is
aggregated with the appropriate method:
| Type | Method | Variables |
|---|---|---|
| Classification | mode | cloud_mask, cloud_type, cloud_phase |
| Continuous | mean | cloud_top_height, AOT, temperature |
| Uncertainty | RMS | error estimates |
| Quality | max | quality_status |
print(f"Converting at HEALPix depth {MSI_DEPTH} on {ELLIPSOID} ellipsoid")
print(f"Variables to convert: {len(MSI_VARIABLES)}")

msi_healpix = convert_msi_to_healpix(
    datasets=products,
    variables=MSI_VARIABLES,
    depth=MSI_DEPTH,
    ellipsoid=ELLIPSOID,
)

# Add metadata
msi_healpix.attrs.update({
    "source": "EarthCARE MSI L2A",
    "healpix_level": MSI_DEPTH,
    "healpix_indexing": "nested",
    "healpix_ellipsoid": ELLIPSOID,
    "orbit_and_frame": ORBIT,
})

# Add xdggs index
msi_healpix = xdggs.decode(
    msi_healpix,
    grid_info=xdggs.HealpixInfo(level=MSI_DEPTH, indexing_scheme="nested"),
)

print(msi_healpix)
Converting at HEALPix depth 17 on WGS84 ellipsoid
Variables to convert: 18
<xarray.Dataset> Size: 320MB
Dimensions: (cell_ids: 4004112)
Coordinates:
* cell_ids (cell_ids) uint64 32MB 11285471774...
Data variables: (12/18)
cloud_mask (cell_ids) float32 16MB 3.0 ... 3.0
cloud_type (cell_ids) float32 16MB 0.0 ... nan
cloud_phase (cell_ids) float32 16MB 1.0 ... 1.0
surface_classification (cell_ids) float32 16MB -3.276e+04...
quality_status (cell_ids) float32 16MB 0.0 ... 1.0
cloud_top_height (cell_ids) float32 16MB nan ... nan
... ...
isccp_cloud_type (cell_ids) float32 16MB -127.0 ......
aerosol_optical_thickness_670nm (cell_ids) float32 16MB nan ... nan
aerosol_optical_thickness_865nm (cell_ids) float32 16MB nan ... nan
angstrom_parameter_670nm_865nm (cell_ids) float32 16MB nan ... nan
aerosol_optical_thickness_670nm_error (cell_ids) float32 16MB nan ... nan
aerosol_optical_thickness_865nm_error (cell_ids) float32 16MB nan ... nan
Indexes:
cell_ids HealpixIndex(level=17, indexing_scheme=nested, kind=pandas)
Attributes:
source: EarthCARE MSI L2A
healpix_level: 17
healpix_indexing: nested
healpix_ellipsoid: WGS84
orbit_and_frame: 06109D
Static visualization
Compare different variable types on the HEALPix grid.
import cartopy.crs as ccrs
import cartopy.feature as cfeature

cell_lon, cell_lat = hpxg.nested.healpix_to_lonlat(
    msi_healpix.cell_ids.values, depth=MSI_DEPTH, ellipsoid=ELLIPSOID
)

plot_vars = [
    ("cloud_mask", "Cloud Mask (mode)", "Set1", 0, 3),
    ("cloud_type", "Cloud Type (mode)", "tab10", 0, 9),
    ("cloud_top_height", "Cloud Top Height [m] (mean)", "viridis", None, None),
    ("aerosol_optical_thickness_670nm", "AOT 670nm (mean)", "YlOrRd", 0, 0.5),
]
plot_vars = [(v, t, c, vn, vx) for v, t, c, vn, vx in plot_vars if v in msi_healpix]

fig = plt.figure(figsize=(10, 5 * len(plot_vars)))

for i, (var_name, title, cmap, vmin, vmax) in enumerate(plot_vars):
    ax = fig.add_subplot(len(plot_vars), 1, i + 1, projection=ccrs.PlateCarree())
    ax.add_feature(cfeature.COASTLINE, linewidth=0.5)
    ax.add_feature(cfeature.BORDERS, linewidth=0.3)
    ax.add_feature(cfeature.LAND, alpha=0.1)
    gl = ax.gridlines(draw_labels=True, linewidth=0.3)
    gl.top_labels = False
    gl.right_labels = False

    data = msi_healpix[var_name].values
    mask = np.isfinite(data)

    if mask.sum() == 0:
        ax.set_title(f"{title} — no valid data")
        continue

    sc = ax.scatter(
        cell_lon[mask], cell_lat[mask], c=data[mask],
        s=0.5, cmap=cmap, vmin=vmin, vmax=vmax,
        transform=ccrs.PlateCarree(),
    )
    ax.set_title(title, fontsize=12)
    plt.colorbar(sc, ax=ax, shrink=0.8, aspect=30, pad=0.02)

plt.suptitle(f"EarthCARE MSI → HEALPix depth {MSI_DEPTH} ({ELLIPSOID}) — Orbit {ORBIT}", fontsize=13)
plt.tight_layout()
plt.show()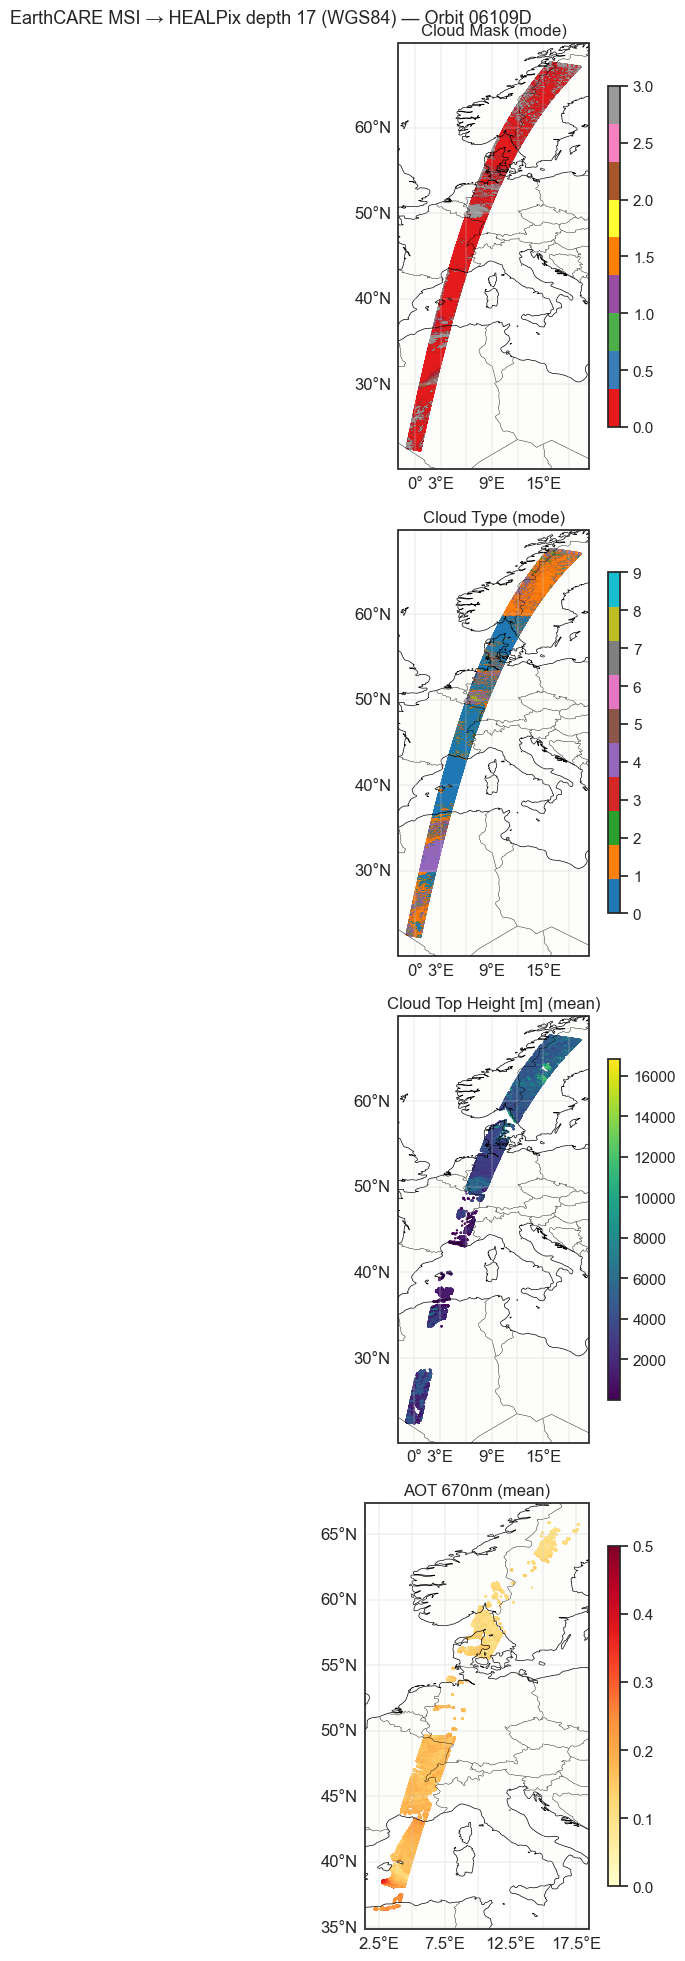
Interactive visualization with xdggs
Use xdggs.explore() for interactive maps with actual HEALPix cell polygons.
This shows how cells align with coastlines and how equal-area cells behave at different latitudes.
# Interactive map — coarsen all variables to depth 10 for visible cells
import numpy_groupies as npg

VIS_DEPTH = 10

# Coarsen each variable with its appropriate aggregation
from earthcare_dggs.settings import MSI_VARIABLES
from earthcare_dggs.convert import aggregate_to_healpix

# Use cloud_mask valid cells as the base grid
base_valid = np.isfinite(msi_healpix["cloud_mask"].values)
base_cell_ids = msi_healpix.cell_ids.values[base_valid]

# Zoom to coarse depth
coarse_ids = hpxg.nested.zoom_to(base_cell_ids, depth=MSI_DEPTH, new_depth=VIS_DEPTH)
unique_coarse = np.unique(coarse_ids)
coarse_to_idx = {c: i for i, c in enumerate(unique_coarse)}

coarse_data = {}
for var_name in msi_healpix.data_vars:
    vals = msi_healpix[var_name].values
    valid = np.isfinite(vals)
    if valid.sum() == 0:
        continue

    # Get coarse cell IDs for this variable's valid cells
    var_cell_ids = msi_healpix.cell_ids.values[valid]
    var_coarse = hpxg.nested.zoom_to(var_cell_ids, depth=MSI_DEPTH, new_depth=VIS_DEPTH)
    var_group = np.array([coarse_to_idx.get(int(c), -1) for c in var_coarse])
    keep = var_group >= 0

    # Pick aggregation method
    agg = MSI_VARIABLES.get(var_name, {}).get("agg", "mean")
    result = aggregate_to_healpix(vals[valid][keep], var_group[keep], len(unique_coarse), method=agg)
    coarse_data[var_name] = result
    print(f"  {var_name}: agg={agg}, valid={np.isfinite(result).sum()}/{len(result)}")

# Build coarse dataset
coarse_ds = xr.Dataset(
    {name: ("cell_ids", data) for name, data in coarse_data.items()},
    coords={"cell_ids": unique_coarse},
)
coarse_ds = xdggs.decode(
    coarse_ds,
    grid_info=xdggs.HealpixInfo(level=VIS_DEPTH, indexing_scheme="nested"),
)

print(f"\nCoarse dataset at depth {VIS_DEPTH}: {len(unique_coarse)} cells, {len(coarse_data)} variables")
print(coarse_ds)
cloud_mask: agg=mode, valid=21580/21580
cloud_type: agg=mode, valid=21547/21580
cloud_phase: agg=mode, valid=12649/21580
surface_classification: agg=mode, valid=21580/21580
quality_status: agg=max, valid=21580/21580
cloud_top_height: agg=mean, valid=10430/21580
cloud_top_temperature: agg=mean, valid=10430/21580
cloud_top_pressure: agg=mean, valid=10430/21580
cloud_optical_thickness: agg=mean, valid=10475/21580
cloud_effective_radius: agg=mean, valid=10475/21580
cloud_water_path: agg=mean, valid=10475/21580
cloud_top_temperature_error: agg=rms, valid=10430/21580
isccp_cloud_type: agg=mode, valid=21580/21580
aerosol_optical_thickness_670nm: agg=mean, valid=5173/21580
aerosol_optical_thickness_865nm: agg=mean, valid=2177/21580
angstrom_parameter_670nm_865nm: agg=mean, valid=2177/21580
aerosol_optical_thickness_670nm_error: agg=rms, valid=5173/21580
aerosol_optical_thickness_865nm_error: agg=rms, valid=2177/21580
Coarse dataset at depth 10: 21580 cells, 18 variables
<xarray.Dataset> Size: 2MB
Dimensions: (cell_ids: 21580)
Coordinates:
* cell_ids (cell_ids) uint64 173kB 688810 ......
Data variables: (12/18)
cloud_mask (cell_ids) float32 86kB 3.0 ... 3.0
cloud_type (cell_ids) float32 86kB 0.0 ... 0.0
cloud_phase (cell_ids) float32 86kB 1.0 ... 1.0
surface_classification (cell_ids) float32 86kB -3.276e+04...
quality_status (cell_ids) float32 86kB 0.0 ... 1.0
cloud_top_height (cell_ids) float32 86kB nan ... nan
... ...
isccp_cloud_type (cell_ids) float32 86kB -127.0 ......
aerosol_optical_thickness_670nm (cell_ids) float32 86kB nan ... nan
aerosol_optical_thickness_865nm (cell_ids) float32 86kB nan ... nan
angstrom_parameter_670nm_865nm (cell_ids) float32 86kB nan ... nan
aerosol_optical_thickness_670nm_error (cell_ids) float32 86kB nan ... nan
aerosol_optical_thickness_865nm_error (cell_ids) float32 86kB nan ... nan
Indexes:
cell_ids HealpixIndex(level=10, indexing_scheme=nested, kind=pandas)
# Interactive explore — use the dropdown to switch between variables
coarse_ds.dggs.explore()Full-resolution zoomed view
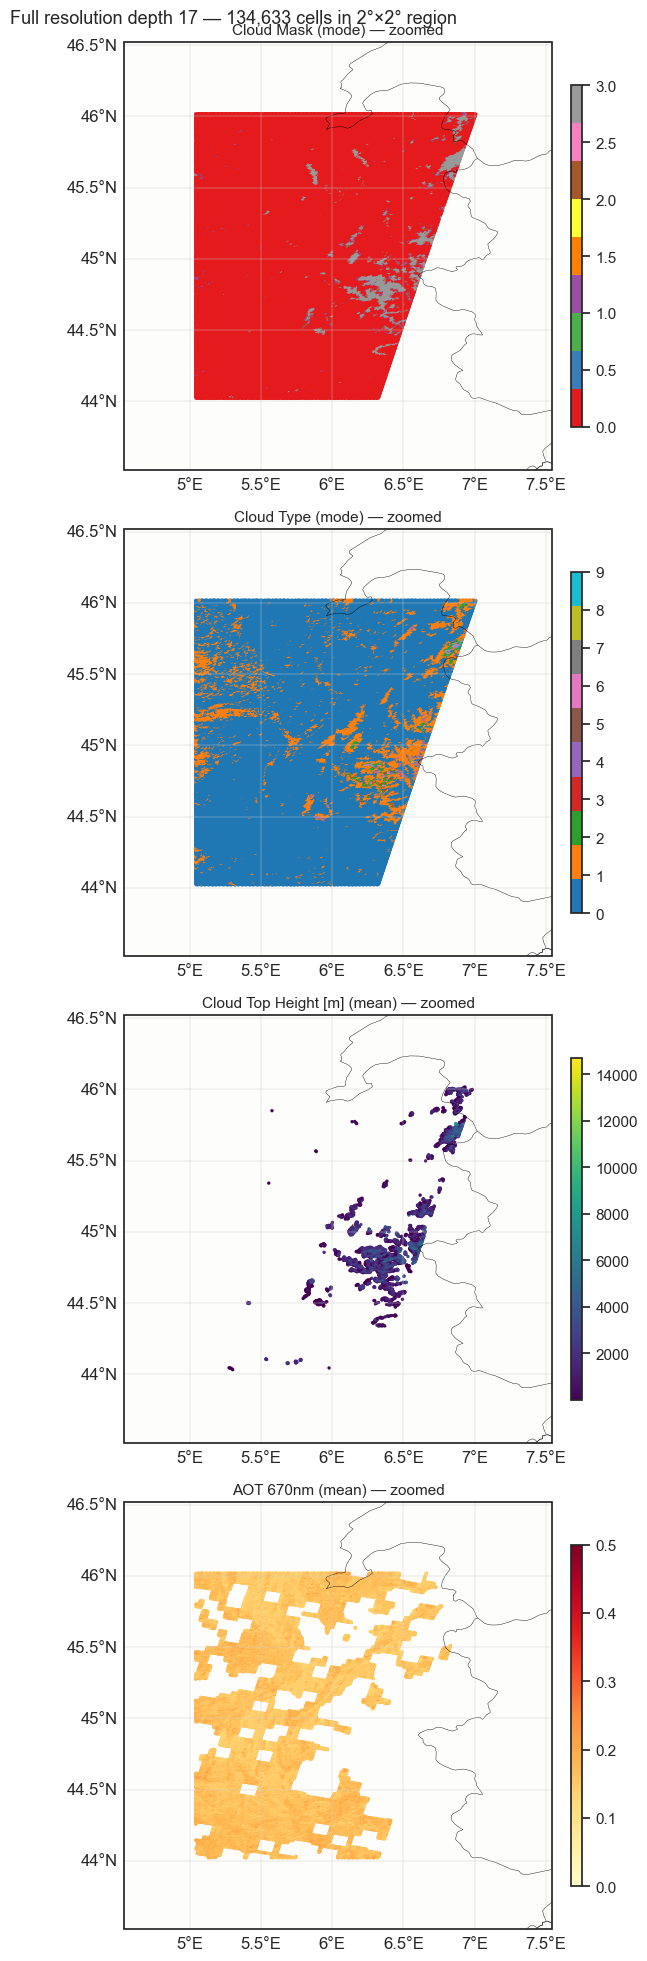
Zoom into a 2°×2° region to see the actual cell distribution at depth 17 (~50m cells). The interactive explore above shows coarsened depth 10 (~58km cells) for overview.
# Full-resolution zoomed view — scatter plot of a small region
# Shows actual cell positions at depth 17 (~50m)

# Zoom into a 2x2 degree region with valid data
centers = msi_healpix.dggs.cell_centers()
valid = np.isfinite(msi_healpix["cloud_mask"].values)
v_lat = centers.latitude.values[valid]
v_lon = centers.longitude.values[valid]

# Pick center of valid data
c_lat, c_lon = np.median(v_lat), np.median(v_lon)
box = 1.0  # degrees
box_mask = (
    valid &
    (centers.latitude.values > c_lat - box) & (centers.latitude.values < c_lat + box) &
    (centers.longitude.values > c_lon - box) & (centers.longitude.values < c_lon + box)
)
box_lon = centers.longitude.values[box_mask]
box_lat = centers.latitude.values[box_mask]
print(f"Zoomed region: {c_lat-box:.1f}-{c_lat+box:.1f}N, {c_lon-box:.1f}-{c_lon+box:.1f}E")
print(f"Cells in region: {box_mask.sum():,}")

plot_vars = [
    ("cloud_mask", "Cloud Mask (mode)", "Set1", 0, 3),
    ("cloud_type", "Cloud Type (mode)", "tab10", 0, 9),
    ("cloud_top_height", "Cloud Top Height [m] (mean)", "viridis", None, None),
    ("aerosol_optical_thickness_670nm", "AOT 670nm (mean)", "YlOrRd", 0, 0.5),
]
plot_vars = [(v, t, c, vn, vx) for v, t, c, vn, vx in plot_vars if v in msi_healpix]

fig = plt.figure(figsize=(10, 5 * len(plot_vars)))
for j, (var_name, title, cmap, vmin, vmax) in enumerate(plot_vars):
    ax = fig.add_subplot(len(plot_vars), 1, j + 1, projection=ccrs.PlateCarree())
    ax.add_feature(cfeature.COASTLINE, linewidth=0.5)
    ax.add_feature(cfeature.BORDERS, linewidth=0.3)
    ax.add_feature(cfeature.LAND, alpha=0.1)
    gl = ax.gridlines(draw_labels=True, linewidth=0.3)
    gl.top_labels = False
    gl.right_labels = False

    data = msi_healpix[var_name].values[box_mask]
    d_mask = np.isfinite(data)
    if d_mask.sum() > 0:
        sc = ax.scatter(
            box_lon[d_mask], box_lat[d_mask], c=data[d_mask],
            s=2, cmap=cmap, vmin=vmin, vmax=vmax,
            transform=ccrs.PlateCarree(),
        )
        plt.colorbar(sc, ax=ax, shrink=0.8, aspect=30, pad=0.02)
    ax.set_extent([c_lon - box - 0.5, c_lon + box + 0.5, c_lat - box - 0.5, c_lat + box + 0.5], crs=ccrs.PlateCarree())
    ax.set_title(f"{title} — zoomed", fontsize=11)

plt.suptitle(f"Full resolution depth {MSI_DEPTH} — {box_mask.sum():,} cells in 2°×2° region", fontsize=13)
plt.tight_layout()
plt.show()
Zoomed region: 44.0-46.0N, 5.0-7.0E
Cells in region: 134,633