Generate the two main-result figures per horizon:
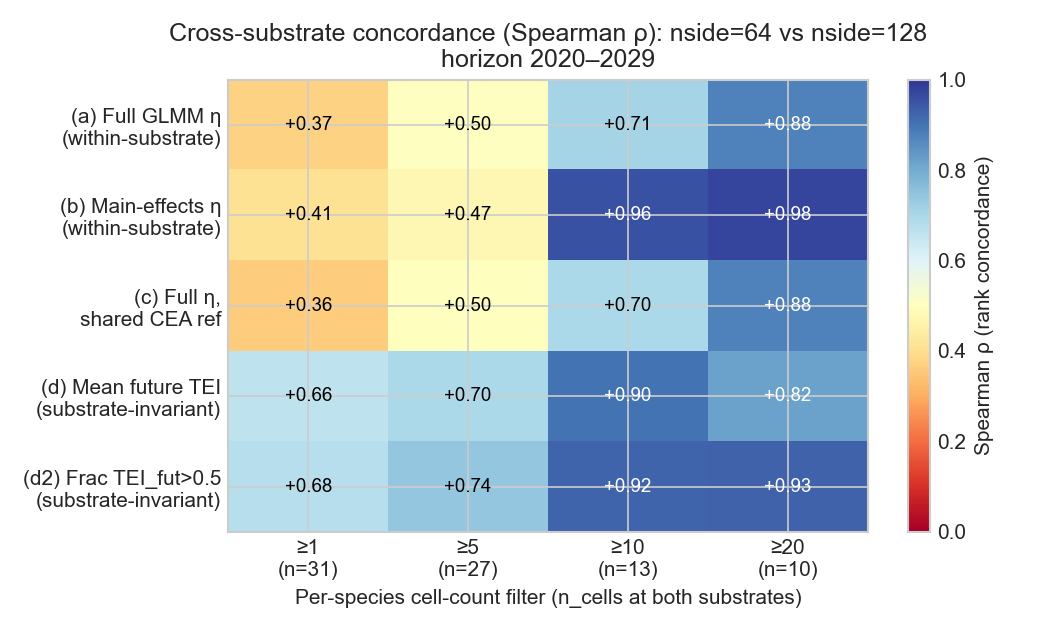
Concordance heatmap — Spearman ρ for variant × n_cells filter.
Variant pair-plot — per-species scatter of η_64 vs η_128 for each of the five variants, points coloured by min(n_cells_64, n_cells_128).
import os
import subprocess
import sys
from pathlib import Path

REPO_ROOT = Path(__file__).resolve().parent.parent

env = {**os.environ, "MPLBACKEND": "Agg"}
for horizon in ("2020_2029", "2030_2039"):
    cmd = [sys.executable, str(REPO_ROOT / "scripts" / "plot_variant_concordance.py"),
           "--horizon", horizon]
    print(f"=== Horizon {horizon} ===")
    print("Running:", " ".join(cmd))
    subprocess.run(cmd, check=True, env=env)
Mid-term horizon (2030–2039)
Cross-substrate concordance
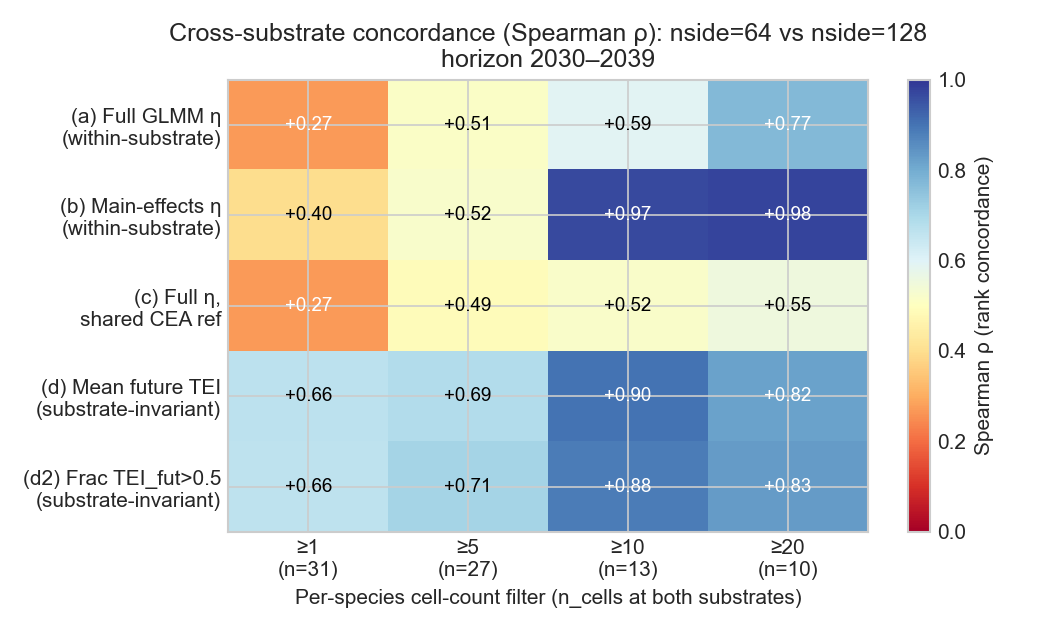
At n_cells ≥ 10, variant (b) main-effects-only η lifts cross-substrate Spearman ρ from +0.59 (full GLMM) to +0.97 — near-perfect agreement. Variant (c) shared CEA reference standardisation barely improves on (a), refuting the “standardisation alone fixes it” hypothesis.
Per-variant scatter
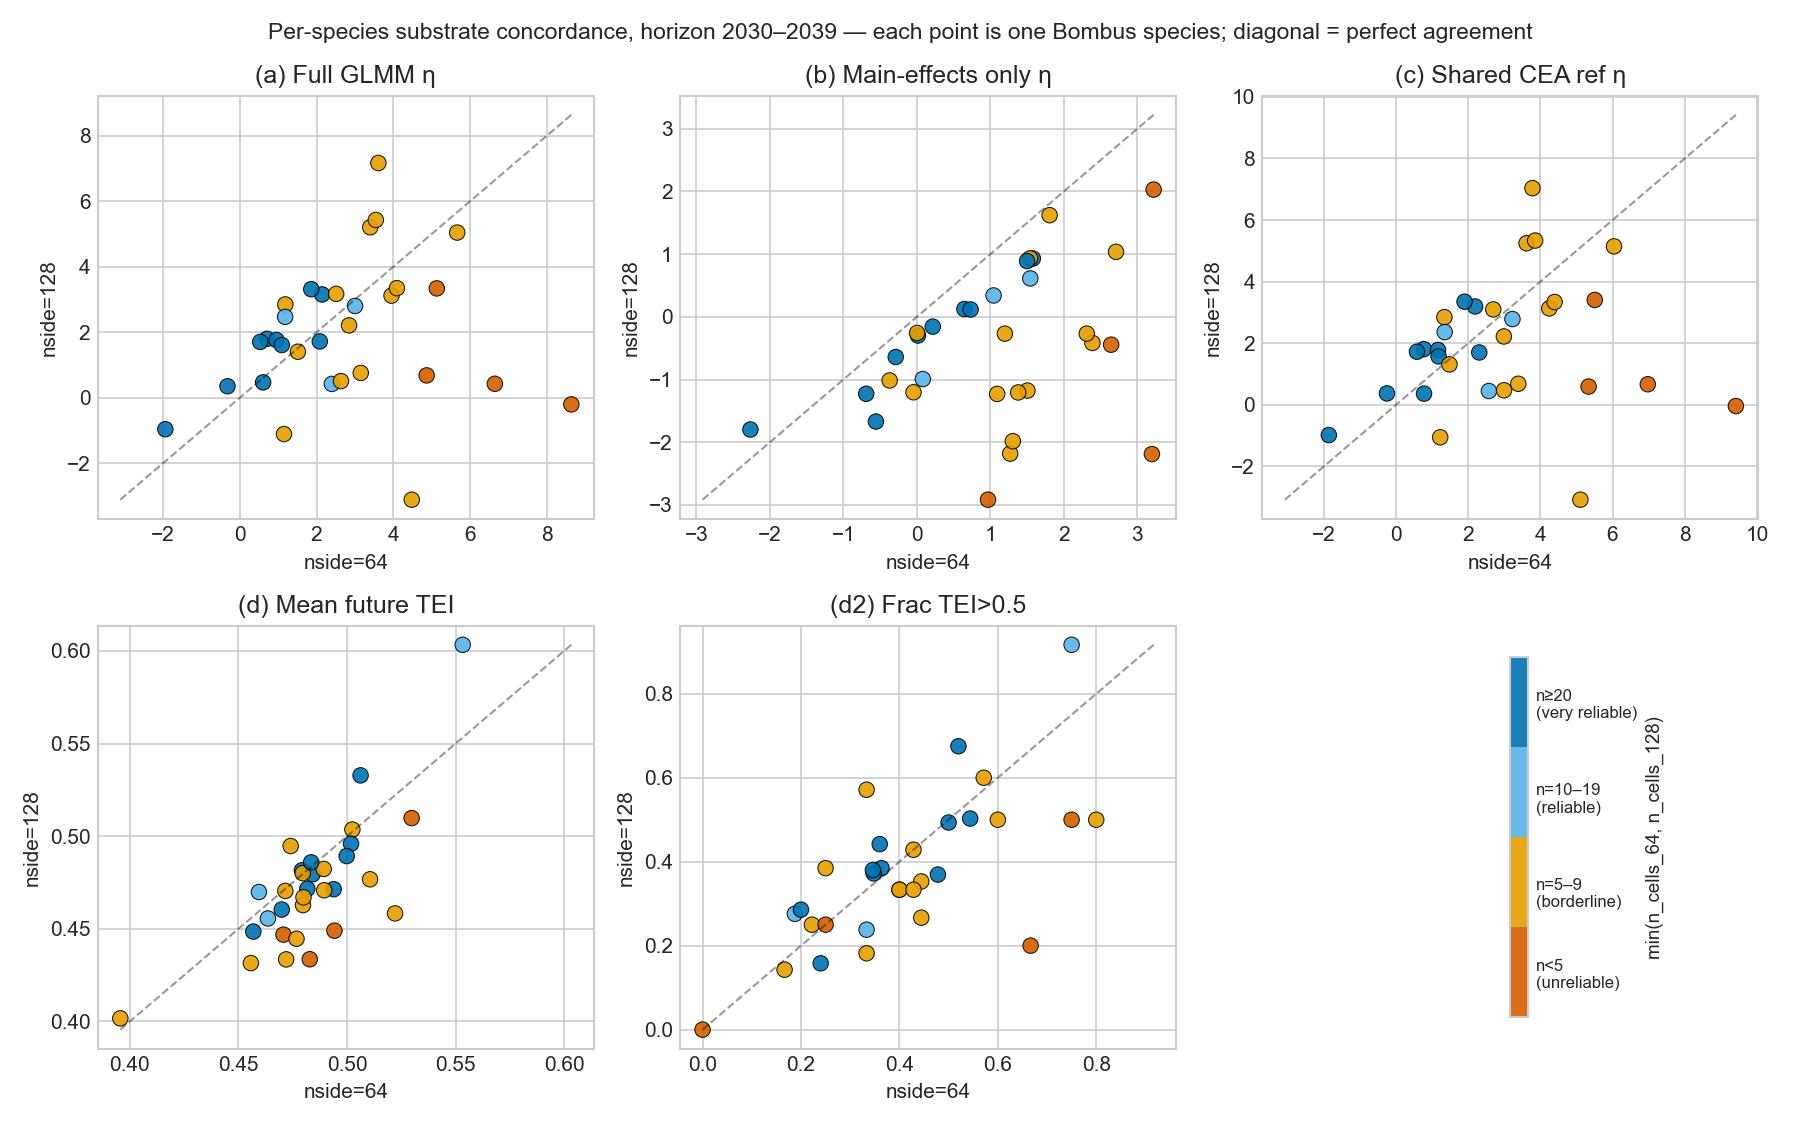
Each panel is one of the five projection variants. The diagonal is perfect agreement between substrates; points are coloured by min(n_cells_64, n_cells_128). High-N (yellow) species cluster on the diagonal in every variant; low-N (dark) species sit far off the diagonal in (a)/(b)/(c) but converge in (d)/(d2).
Near-term horizon (2020–2029)
Cross-substrate concordance
Per-variant scatter
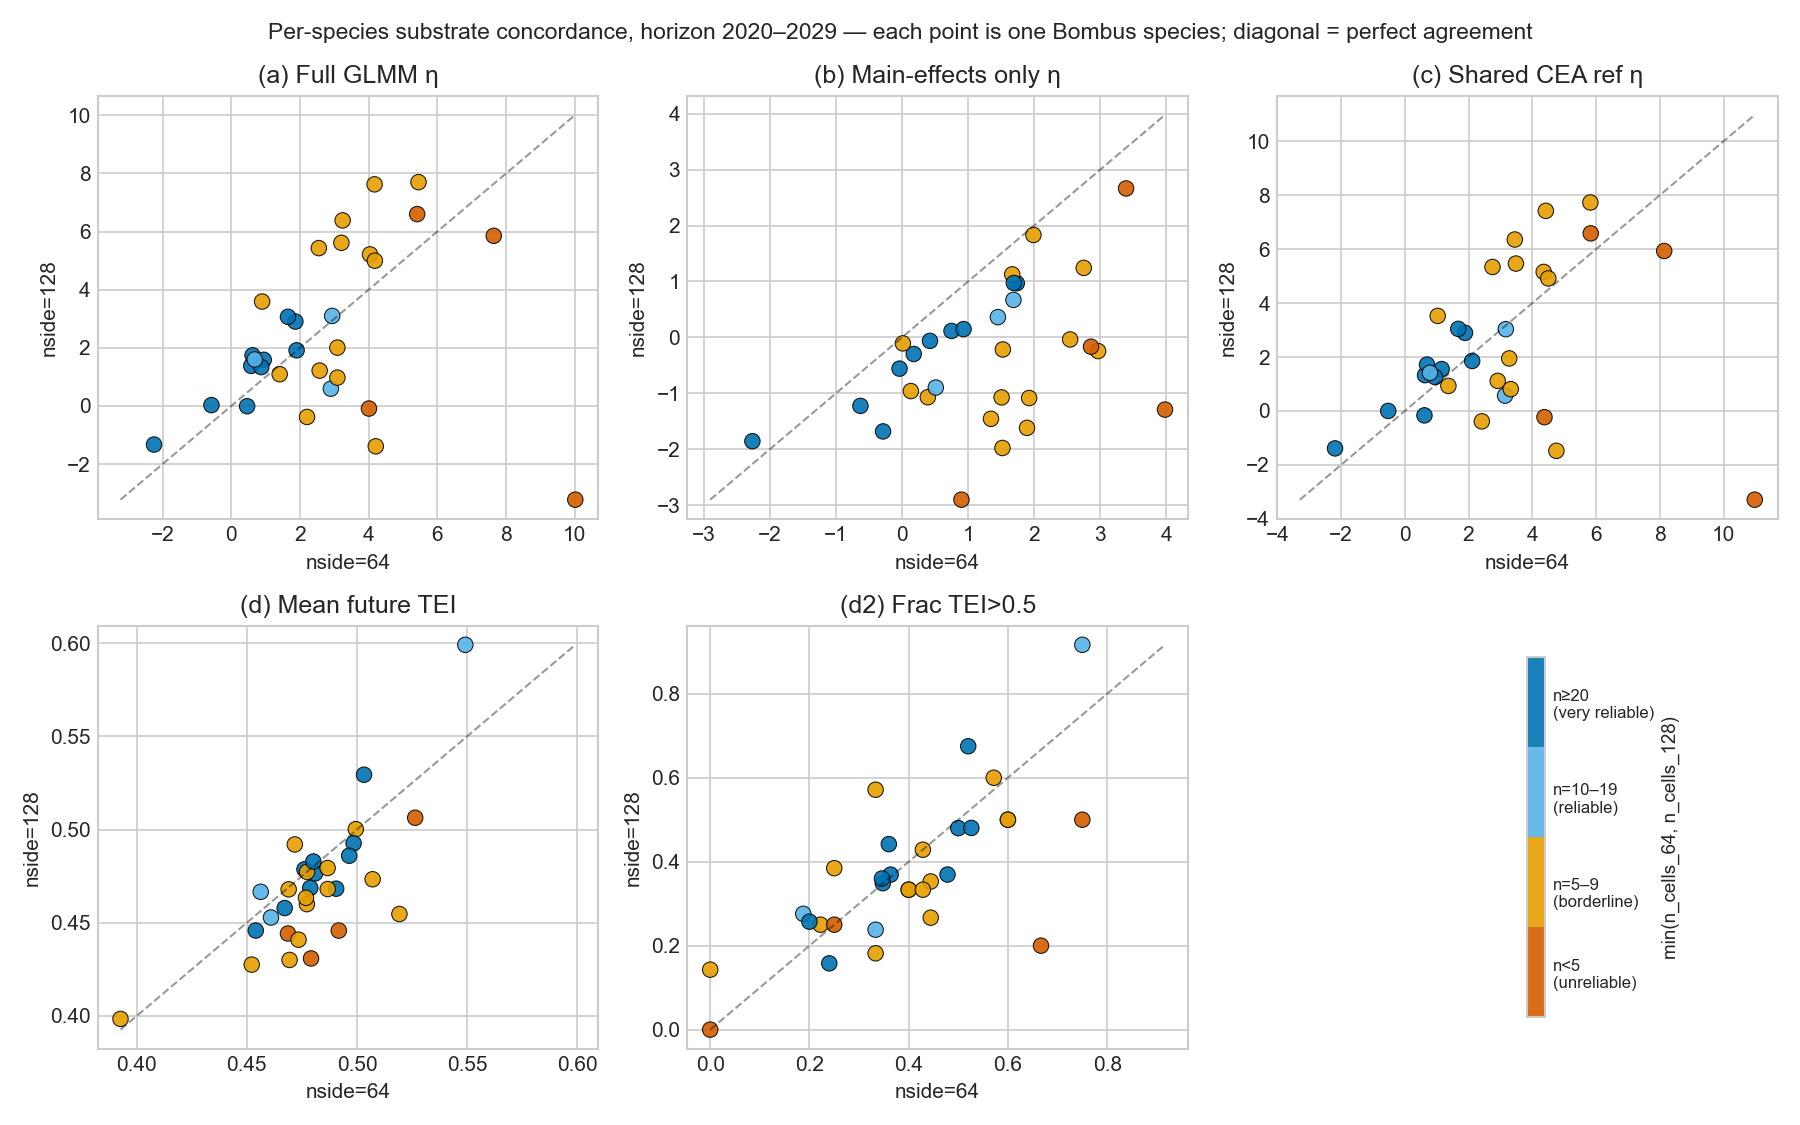
The near-term horizon shows the same qualitative pattern as 2030–2039, with slightly higher overall concordance because future predictors lie closer to the historical training distribution (less extrapolation).