Substrate-sensitivity diagnostic for TEI-based extirpation projection. Per-species ranking under future climate is grid-coupled at the projection step. Here is the mechanism, and three principled fixes.
This repository is a methodological follow-up to two single-substrate replications of Soroye et al. 2020 (Soroye et al. (2020)) for Iberian Bombus under DestinE Climate DT SSP3-7.0:
| Substrate | Repo | Purpose |
|---|---|---|
| HEALPix nside=64 (~92 km) | weatherxbiodiversity-projection | canonical replication |
| HEALPix nside=128 (~46 km) | weatherxbiodiversity-projection-nside128 | resolution extension |
Both single-substrate Outcomes are Substrate-robust: the GLMM coefficient on sc_TEI_delta is positive, large, and credible at all three pixelisations (CEA, nside=64, nside=128) — within ±30%. Soroye’s central biological claim replicates on Iberian Bombus.
But when the same GLMM is asked to project to future climate, per-species rankings diverge across substrates by 1–9 logits. This repo asks: why does that happen, and how should it be done properly?
Headline finding
Substrate-coupling is not caused by per-species random-effect refit (substrate-stable, ΔRE ≤ 0.6 logits) or per-species niche-limit refit (modest, ΔT_range = 0–3°C). It is caused by two mechanisms acting together:
Per-species sample size at projection time. Below ~10 occupied + active cells per substrate, per-cell extrapolation noise dominates the species mean η, regardless of which projection variant is used.
The GLMM interaction term
sc_TEI_delta:sc_PEI_deltacompounds substrate-specific standardisation quadratically when future predictors extrapolate 2–4σ outside the training distribution. The same physical climate signal z-scores to opposite tails of the standardised distribution under each substrate’s local (μ, σ); the interaction term scales as the product, amplifying the divergence.
Per-species view
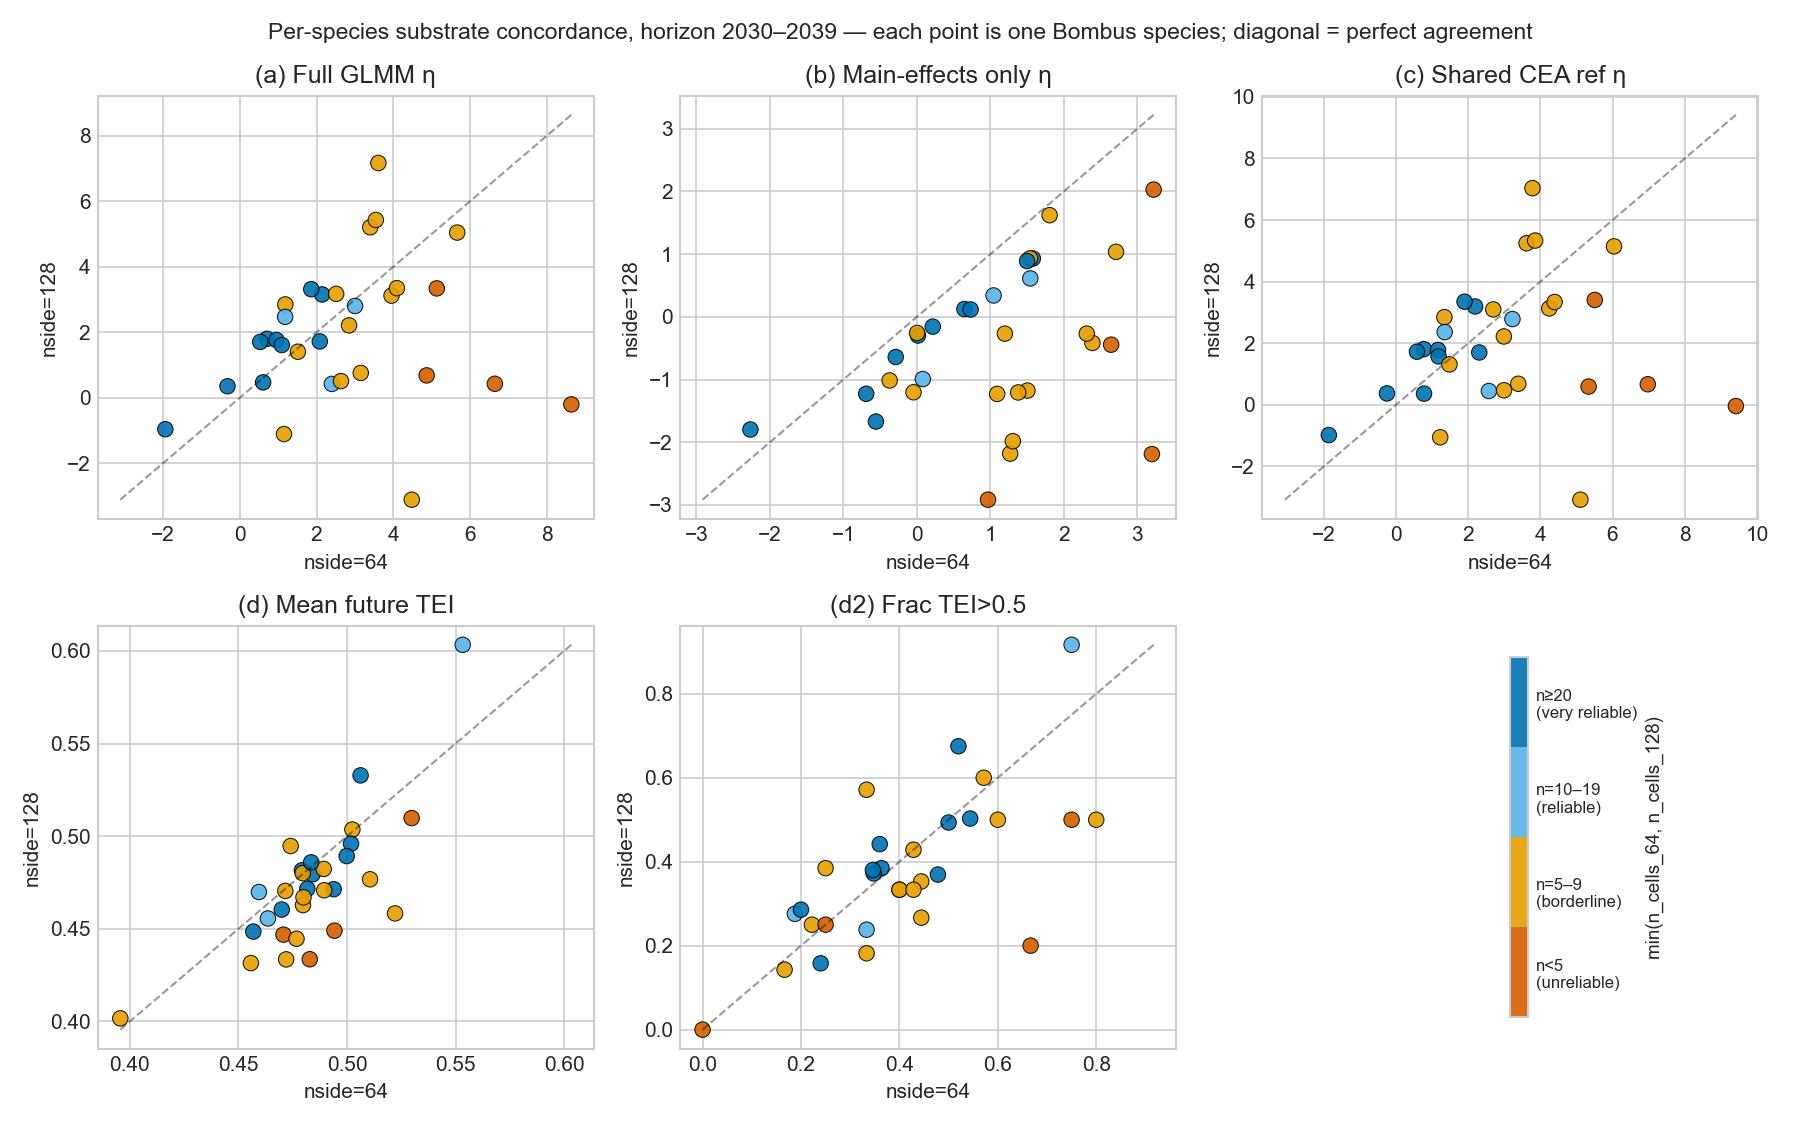
Each panel is one of the five projection variants. The diagonal is perfect agreement between substrates. Yellow dots (n_cells ≥ 50) sit on the diagonal in every variant; dark dots (n_cells ≤ 5) sit far off. The substrate-invariant physical metrics (d) and (d2) bring the small-N species back toward the diagonal.
Recommended reporting protocol
For any future TEI-based extirpation projection that compares across substrates:
Report only on species with ≥ 10 occupied + active cells per substrate.
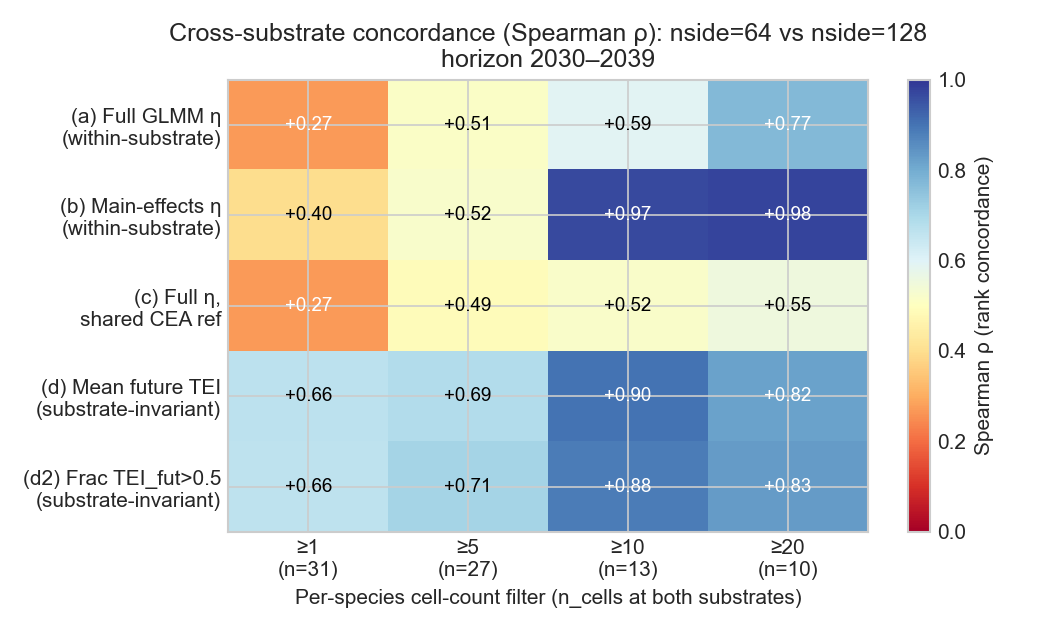
Drop the GLMM interaction terms at projection time — keep them in the fit, but use main-effects-only η to extrapolate. At n≥10 this lifts the cross-substrate Spearman ρ from +0.59 to +0.97 (mid-term horizon, both substrates).
Cross-check against a substrate-invariant physical metric — mean future TEI, or fraction of cells where future TEI > 0.5. Both hit ρ ≥ 0.66 across the entire species set including small-N species.
See results/SUBSTRATE_SENSITIVITY_FINDINGS.md for the full evidence — variant comparison tables at both horizons, decomposition of η into 10 GLMM terms per species, and refuted hypotheses.
Pipeline
The four-notebook pipeline is documented in the chapter list on the left:
01 — Inputs fetch. Symlinks (development) or downloads (Zenodo) the upstream substrate artefacts.
02 — Decompose. Per-species η decomposition diagnostic at the SSP3-7.0 mid-term horizon (12 diagnostic species).
03 — Variants. Five-variant cross-substrate Spearman concordance at both horizons (2020–2029 and 2030–2039).
04 — Figures. Concordance heatmap + per-variant scatter pair-plots.
Citation
If you use this work, please cite:
This software:
CITATION.cff→ DOI Fouilloux (2026).The original paper: Soroye et al. (2020).
The two upstream substrate replications via their own DOIs (see CITATION.cff
references).
- Soroye, P., Newbold, T., & Kerr, J. (2020). Climate change contributes to widespread declines among bumble bees across continents. Science, 367(6478), 685–688. 10.1126/science.aax8591
- Fouilloux, A. (2026). weatherxbiodiversity-substrate-sensitivity. Zenodo. 10.5281/ZENODO.20113786