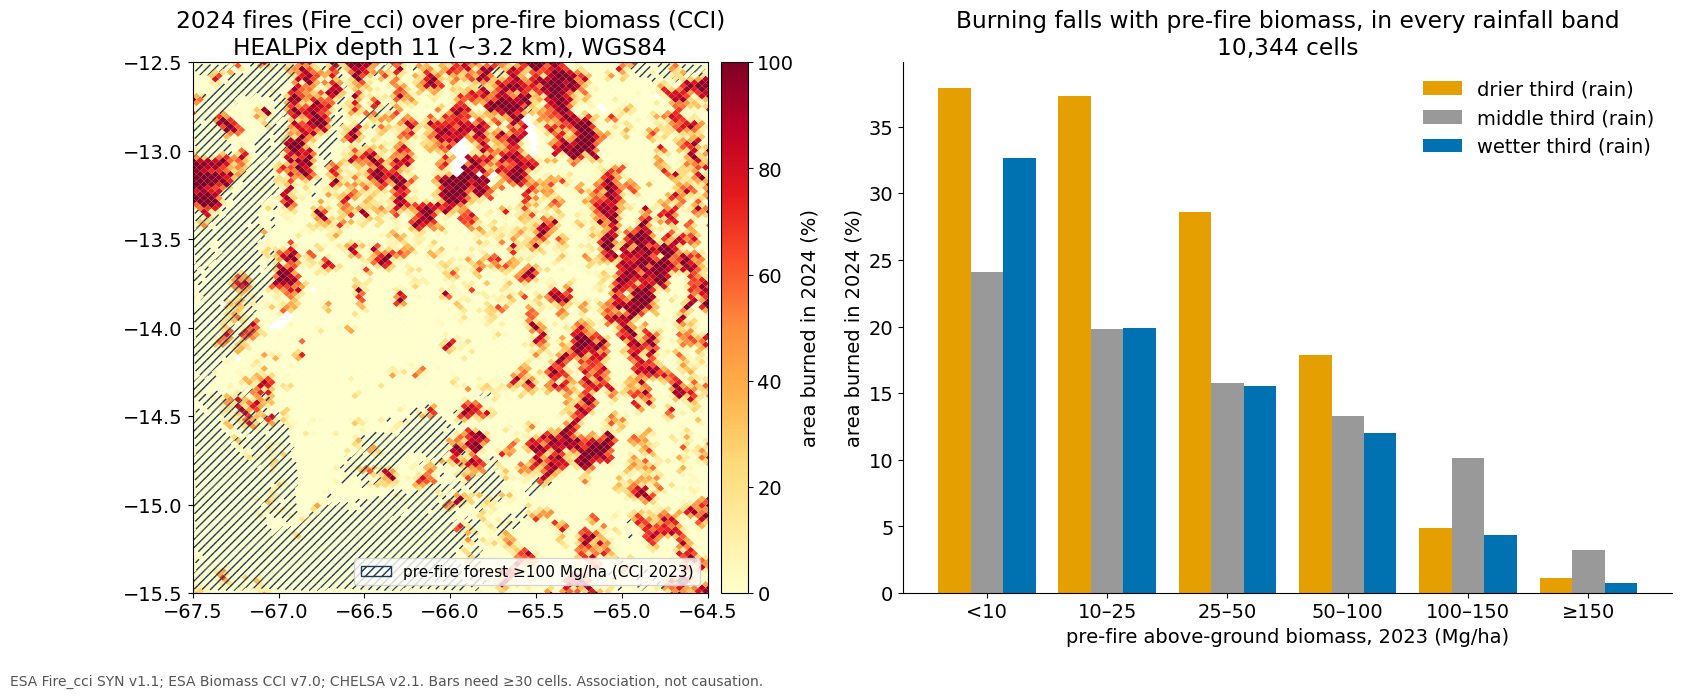
Left: share of each cell burned in 2024, with dense pre-fire forest hatched. Right: burned share by pre-fire biomass class, within each rainfall tercile. Colours are colour-blind safe (Okabe–Ito).
import json
from pathlib import Path

import matplotlib.pyplot as plt
import numpy as np
import pandas as pd
from healpix_geo import nested
from matplotlib.collections import PolyCollection

df = pd.read_parquet("../data/clean/beni_cells.parquet")
summ = json.loads(Path("../results/headline.json").read_text())
table = pd.read_csv("../results/summary.csv")
FIG = Path("../figures"); FIG.mkdir(exist_ok=True)
vlon, vlat = nested.vertices(df.cell_id.to_numpy(np.uint64), np.uint8(11), ellipsoid="WGS84")
vlon = np.where(vlon > 180, vlon - 360, vlon)
polys = [np.column_stack([lo, la]) for lo, la in zip(vlon, vlat)]

plt.rcParams.update({"font.size": 14})
fig, axes = plt.subplots(1, 2, figsize=(17, 7), gridspec_kw={"width_ratios": [1, 1.15]})
ax = axes[0]
b = df.burned_share_2024.to_numpy(); ok = np.isfinite(b)
pc = PolyCollection([p for p, k in zip(polys, ok) if k], array=100 * b[ok], cmap="YlOrRd", clim=(0, 100), edgecolor="none")
ax.add_collection(pc)
forest = (df.agb_2023_mg_ha >= 100).to_numpy()
ax.add_collection(PolyCollection([p for p, k in zip(polys, forest) if k], facecolor="none", hatch="////", edgecolor="#1B3A5C", linewidth=0))
ax.fill_between([], [], facecolor="none", hatch="////", edgecolor="#1B3A5C", label="pre-fire forest ≥100 Mg/ha (CCI 2023)")
fig.colorbar(pc, ax=ax, fraction=0.046, pad=0.02, label="area burned in 2024 (%)")
ax.set_xlim(-67.5, -64.5); ax.set_ylim(-15.5, -12.5); ax.set_aspect(1 / np.cos(np.radians(-14)))
ax.legend(loc="lower right", fontsize=11)
ax.set_title("2024 fires (Fire_cci) over pre-fire biomass (CCI)\nHEALPix depth 11 (~3.2 km), WGS84")

ax = axes[1]
labels = ["<10", "10–25", "25–50", "50–100", "100–150", "≥150"]
cols = {"drier": "#E69F00", "middle": "#999999", "wetter": "#0072B2"}
x = np.arange(len(labels)); w = 0.27
for i, (t, c) in enumerate(cols.items()):
    g = table[table.rain_tercile == t].set_index("agb_class").reindex(labels)
    vals = np.where(g.n_cells >= 30, g.mean_burned_pct, np.nan)
    ax.bar(x + (i - 1) * w, vals, w, color=c, label=f"{t} third (rain)")
ax.set_xticks(x, labels); ax.set_xlabel("pre-fire above-ground biomass, 2023 (Mg/ha)"); ax.set_ylabel("area burned in 2024 (%)")
ax.set_title(f"Burning falls with pre-fire biomass, in every rainfall band\n{summ['n_cells']:,} cells")
ax.legend(frameon=False); ax.spines[["top", "right"]].set_visible(False)
fig.text(0.01, 0.005, "ESA Fire_cci SYN v1.1; ESA Biomass CCI v7.0; CHELSA v2.1. Bars need ≥30 cells. Association, not causation.", fontsize=10, color="#555")
fig.tight_layout(rect=(0, 0.03, 1, 1))
fig.savefig(FIG / "main_result.png", dpi=110)
plt.show()