Part 1: Modern EO Processing Landscape
The Challenge: EO Data Growth
Earth Observation is experiencing unprecedented data growth:
The 4 V’s of EO Big Data:
- Volume: Petabytes of new satellite data daily
- Velocity: Near real-time processing requirements
- Variety: Multiple sensors, formats, and resolutions
- Veracity: Quality assessment and validation needs
Traditional vs. Cloud-Native Processing:
| Traditional EO Processing | Modern Cloud-Native Processing |
|---|---|
| Download → Store Locally → Process | Discover → Access in Cloud → Process at Scale |
| Limitations: | Advantages: |
| Storage constraints | Elastic computing resources |
| Processing bottlenecks | Co-located data and compute |
| Version control issues | Version-controlled workflows |
| Limited collaboration | Real-time collaboration |

Figure 1:Traditional vs. Cloud-Native Processing
What Makes Cloud-Native EO Processing Possible
Modern EO workflows depend on a few key innovations working together:
- Packaged Software: Applications that can run anywhere - your laptop, university servers, or cloud platforms
- Scalable Computing: Automatically adding more processing power when needed, like having extra workers during busy times
- Cloud Storage: Data stored on the internet that any computer can access directly, eliminating downloads
- Cloud-friendly Data Formats: Files organized so you can read just the parts you need, like reading one chapter instead of an entire book
The Key Insight: These technologies work together to make data processing feel like using a web browser - instant access to information without worrying about where it’s stored or how much computing power you need.
Data Cube: Organizing EO Data Across Spatial, Temporal, and Spectral Dimensions
In Earth Observation (EO), data is inherently multidimensional, spanning space, time, and the electromagnetic spectrum. To efficiently manage and analyze such complex, large-scale datasets, the concept of the data cube is essential.
A data cube is a structured, multidimensional array that organizes EO data along several key dimensions:
- Spatial Coordinates (X, Y): Represent the geographic location using longitude and latitude.
- Temporal Dimension (Time): Captures changes over time, enabling time series analyses and monitoring.
- Spectral Dimensions (Bands): Represent the different wavelengths or spectral bands collected by sensors.
- Attributes: Include metadata, quality indicators, and other descriptive information that adds context and reliability to the data.
This multi-dimensional organization facilitates scalable cloud-native processing, supports advanced analyses, and underpins modern EO workflows that aim to unlock the full potential of satellite data for applications in environmental monitoring, climate science, and resource management.
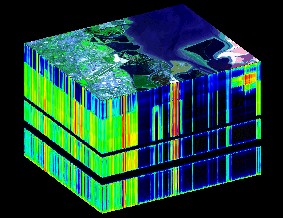
Figure 2:Hyperspectral image ‘data cube’. Credit: University of Texas at Austin, Center for Space Research. Licensed under ESA Standard Licence.