Phase 3 figures from the Iberian Lacertidae h_r mechanism replication under Destination Earth Climate DT SSP3-7.0 (2020-2039). All figures regenerate from snakemake --cores 1 figures after a successful pipeline run.
Figure 1 — Sensitivity matrix (headline)
The mechanism’s behaviour is prior-conditional. Single-axis perturbations of the lizard-biology priors (just T_b, or just the reproductive window) keep the predicted local-extinction rate at 0 %. Only the compound worst-plausible prior (Iberolacerta-style cool-adapted T_b = 31 °C combined with the actual Iberian Podarcis / Iberolacerta May-June breeding chronology) flags ~3 % of Lacertidae cell-years — tail-dominated by single-year extremes rather than monotonic decadal warming.
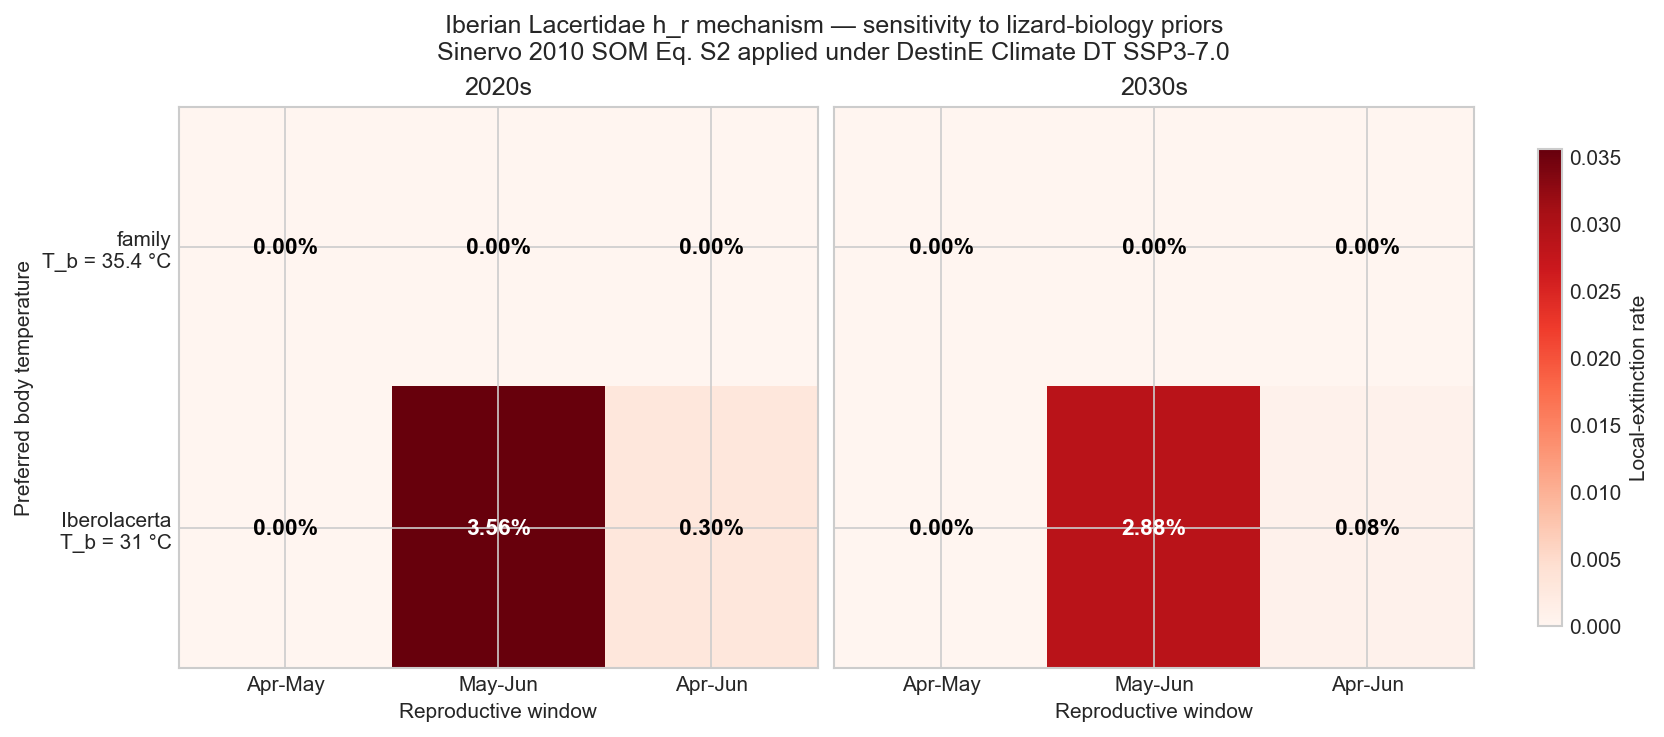
Figure 2 — Per-species local-extinction rate (S3a config)
Per-species rates under the worst-plausible compound prior (S3a: T_b = 31 °C, May-June window). Well-sampled species (n_cells ≥ 10) in solid red; low-N species in faded grey (their rates are grid-coupled per Lobo et al. 2007 and Hurlbert & Jetz 2007). Sinervo Table 1 Lacertidae 2050 / 2080 reference values shown as vertical dashed lines for horizon-context.
The baseline-config variant of this figure is omitted: every species sits at 0 % under family-mean T_b + April-May, which the sensitivity heatmap already shows compactly.
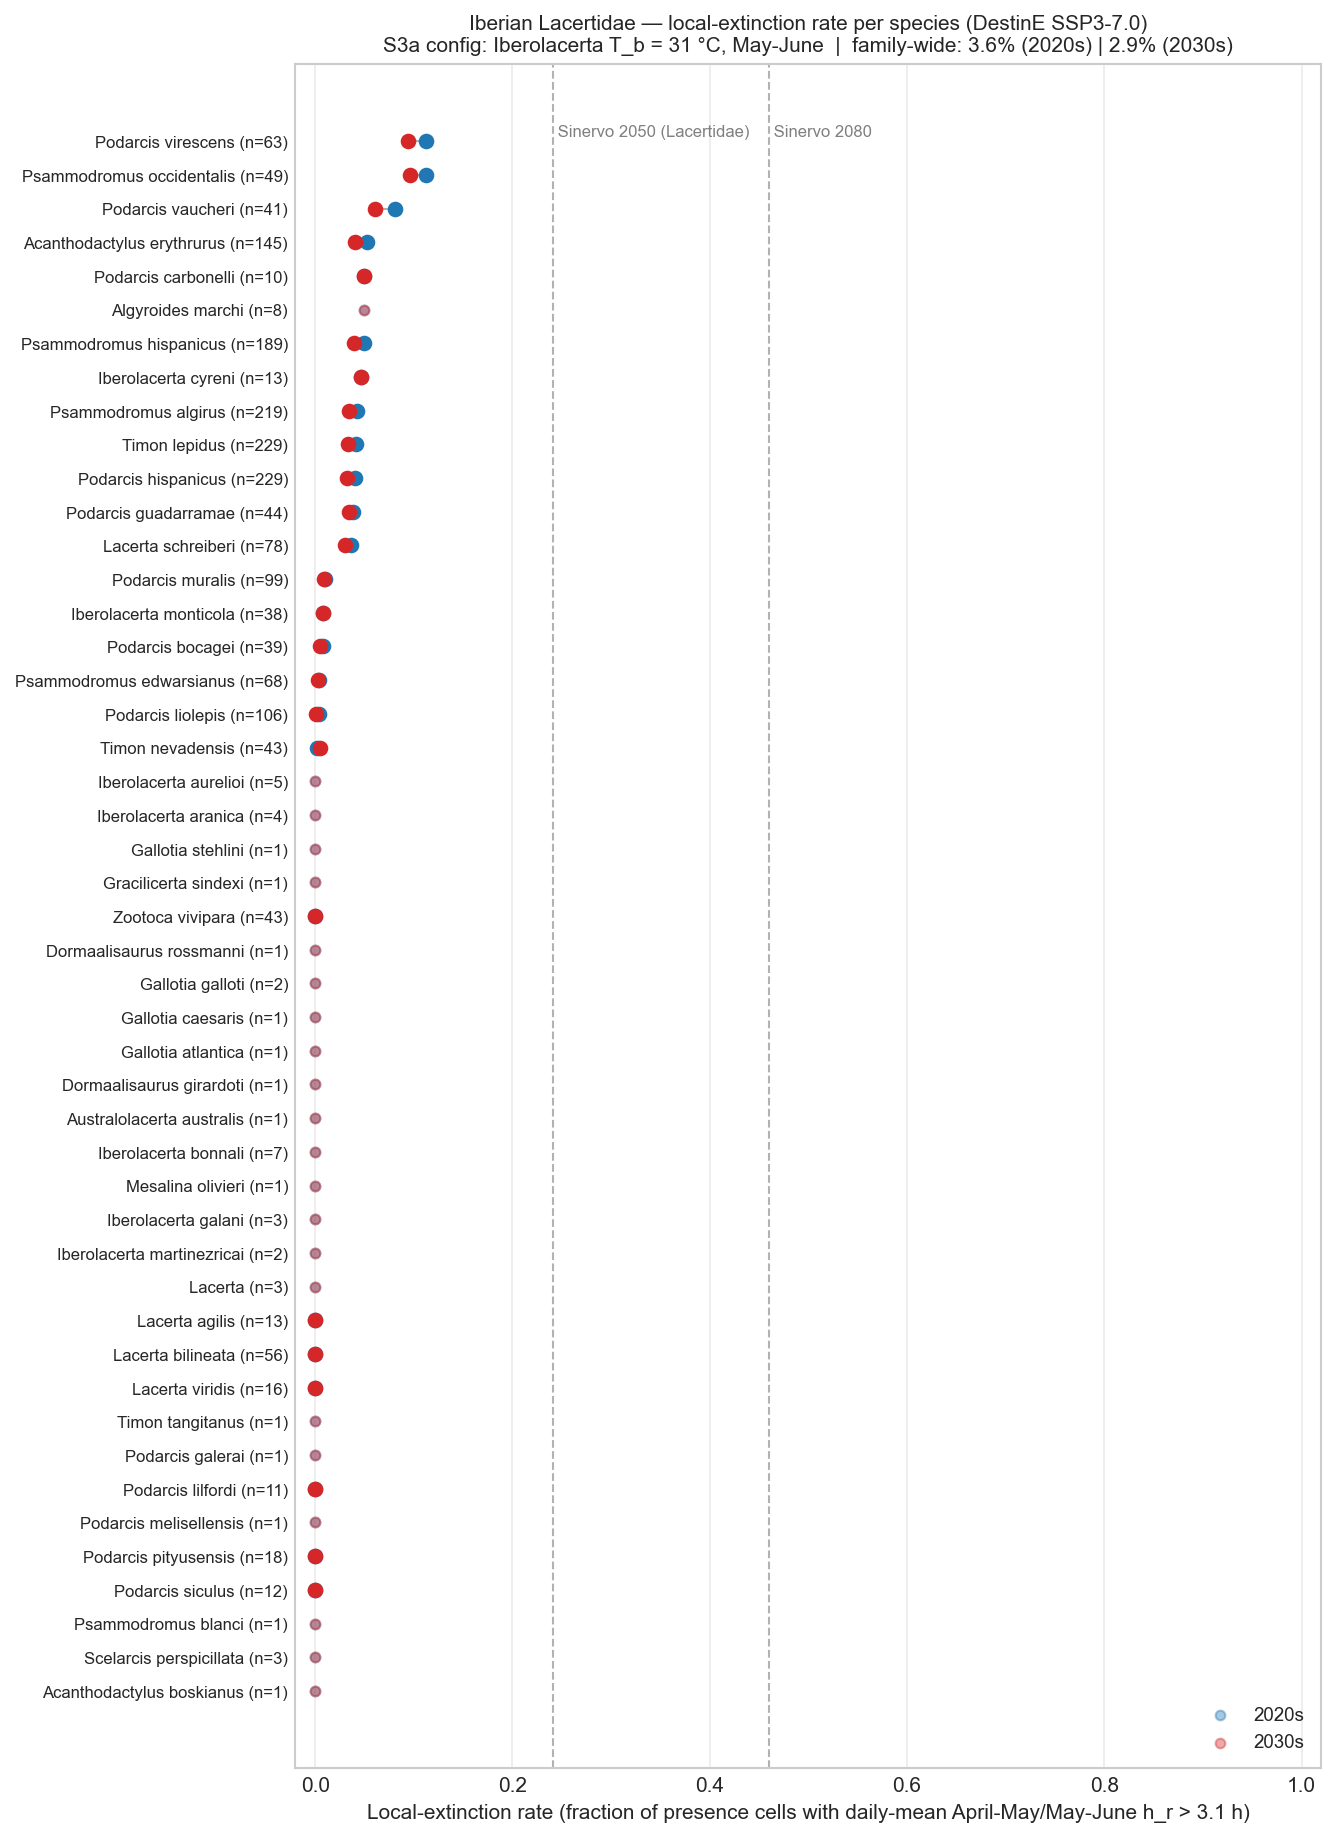
Figure 3 — Substrate-sensitivity diagnostic
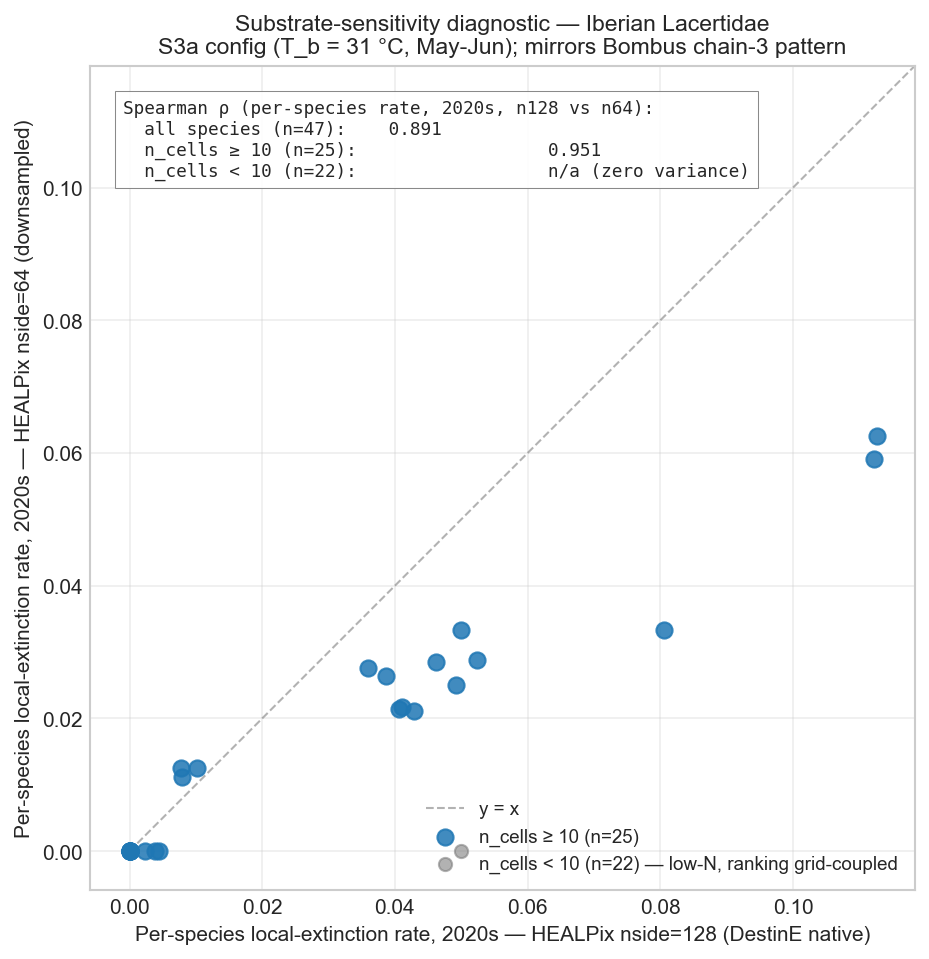
Mirrors the Bombus chain-3 pattern (weatherxbiodiversity-substrate-sensitivity). Per-species 2020s rates at HEALPix nside=128 (DestinE-native substrate) vs nside=64 (downsampled via the NESTED bit-shift parent = pix >> 2). Diagonal is y = x; deviation = substrate-coupled ranking. Spearman ρ = 0.951 for well-sampled species (n_cells ≥ 10), confirming substrate-robust rankings for the population the rare-species ranking caveat does not apply to. The low-N subset (n_cells < 10) is degenerate at this signal level (zero variance — all 22 species collapse to 0 % at both substrates), an operational manifestation of the same caveat.
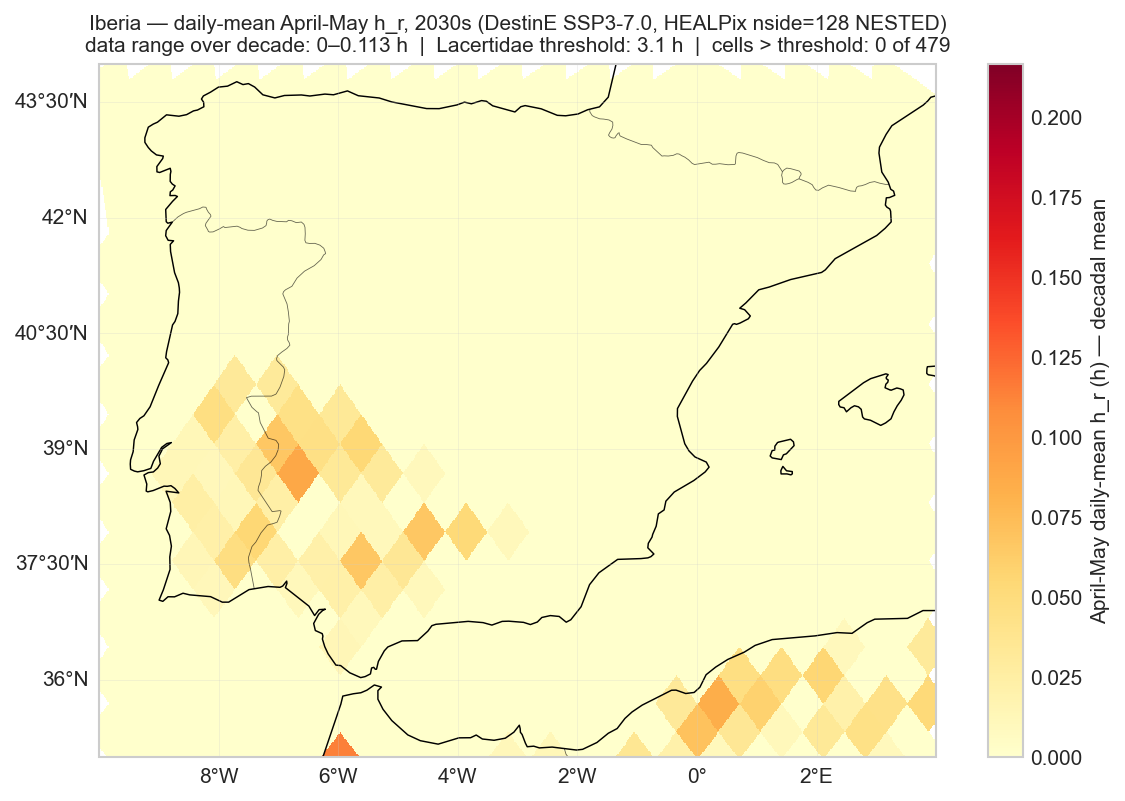
Figures 4 & 5 — Iberia maps of daily-mean h_r per decade
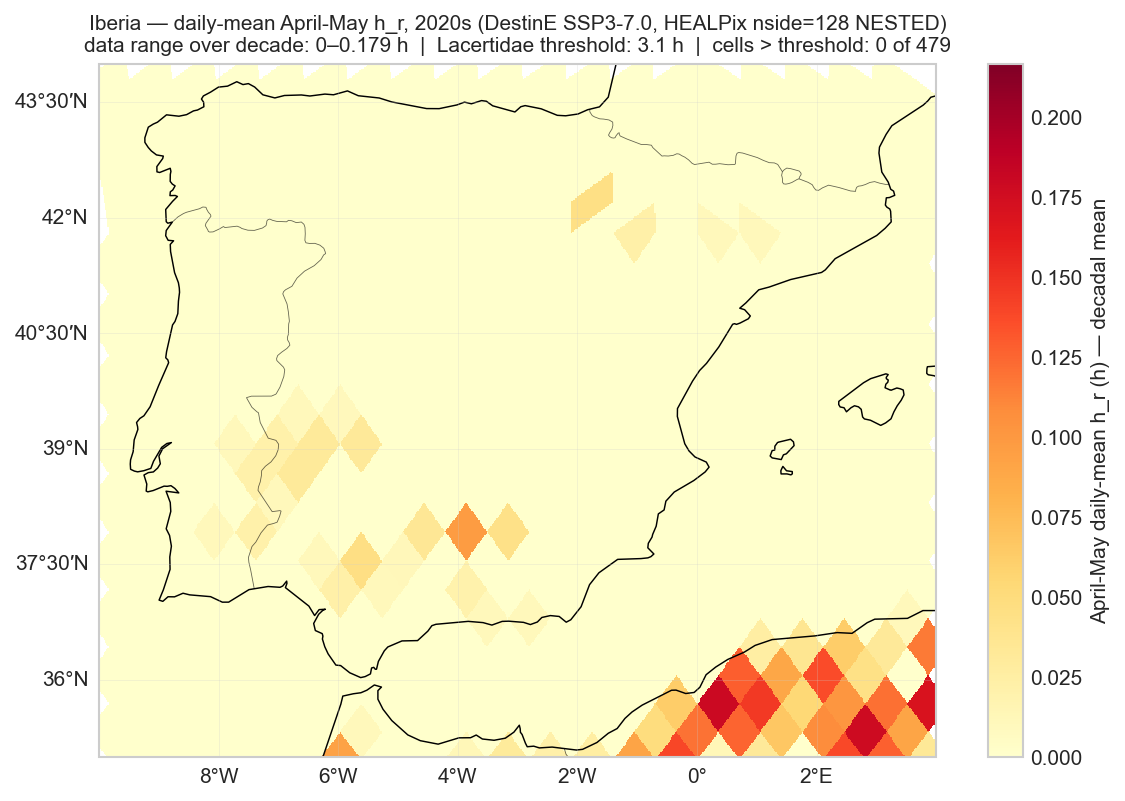
Iberian Peninsula at HEALPix nside=128 NESTED (DestinE-native substrate). Decadal mean of the daily-mean h_r (hours of activity restriction) over the April-May reproductive window. Cells rendered as HEALPix tiles via the EOPF-DGGS healpix-plot library — the DOMAIN.md-canonical replacement for ad-hoc ang2pix + pcolormesh bridges.
Spatial pattern: warmest h_r cells cluster in SW Spain (Andalusia, ~37–38 °N, 6–4 °W) and the south-coast strip — physically plausible (warmest April-May in Iberia). Maximum decadal-mean h_r reaches ~0.11 h at the warmest cells, well below the Lacertidae family-calibrated threshold of 3.1 h, consistent with the 0 % baseline rate in the sensitivity matrix.
2020s
2030s
Reading these figures together
The sensitivity matrix (Figure 1) is the headline: under any single-axis prior perturbation, the mechanism predicts zero local extinction at DestinE-reachable horizons. Only the compound worst-plausible (Iberolacerta + May-June) produces a small signal.
The maps (Figures 4 & 5) confirm spatially: even the warmest Iberian cells in April-May reach h_r ≈ 0.1 h, well below the 3.1 h family threshold. There is no Lacertidae cell anywhere in the Iberian Peninsula whose 2020-2039 April-May daily-mean h_r reaches the threshold.
The S3a per-species figure (Figure 2) identifies which species would be most-at-risk if the cool-adapted Iberolacerta T_b + actual Iberian breeding chronology turned out to be the right parameterisation. The substrate-sensitivity diagnostic (Figure 3) confirms those rankings are robust between HEALPix nside=128 and nside=64 for well-sampled species.
For the full prose Outcome — including limitations, prior-conditional caveats, and the cross-taxon Bombus comparison — see the published FORRT nanopublication chain on platform