Two figures, both with two BoR strategies side-by-side:
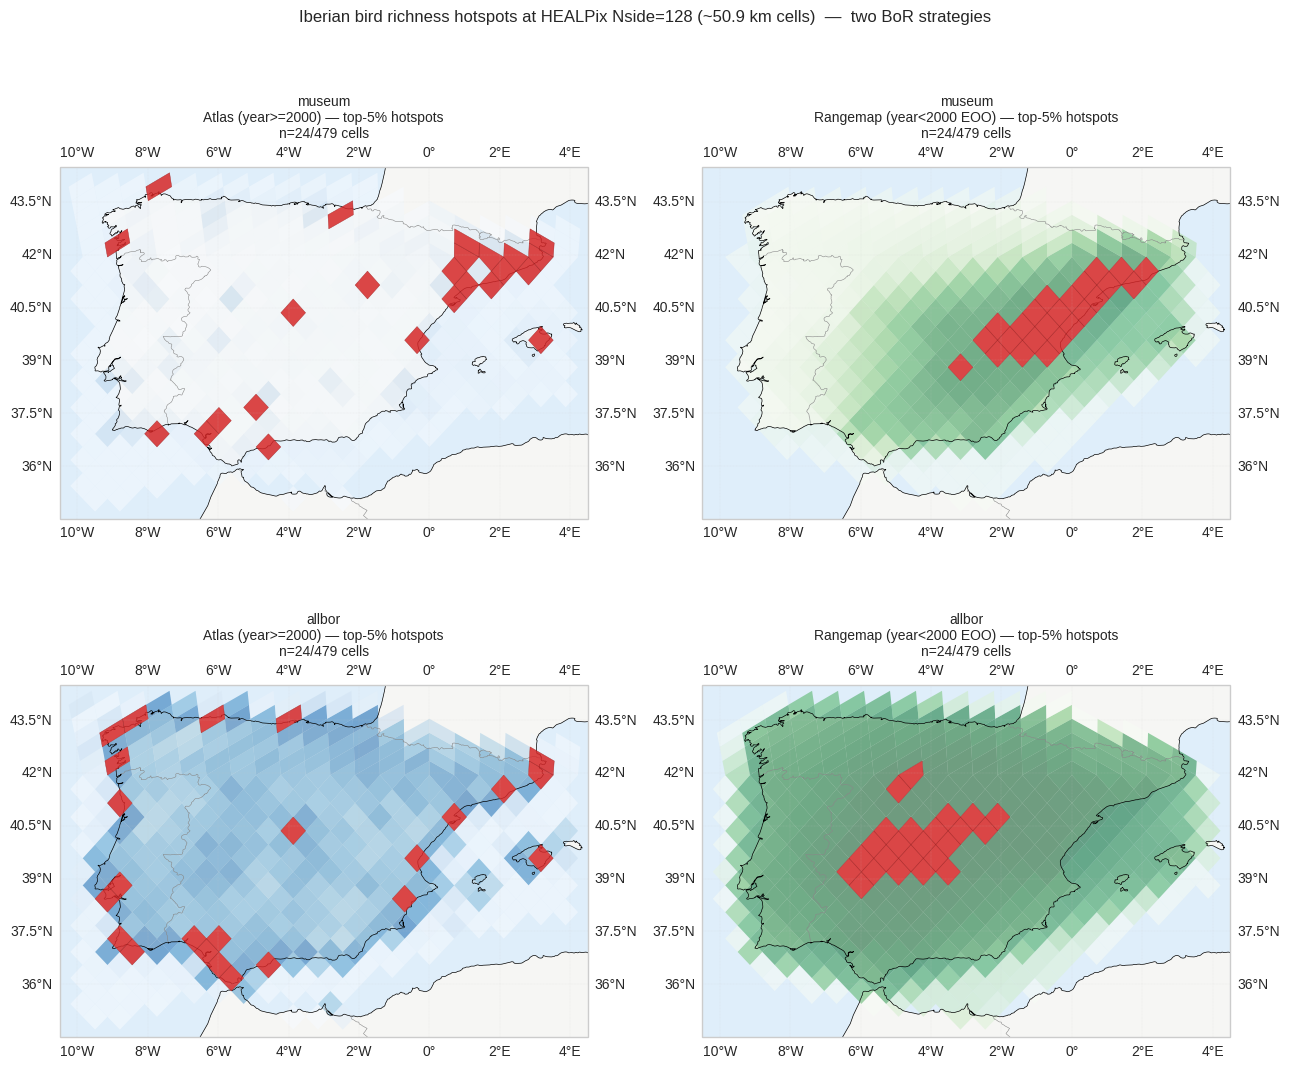
figures/main_result.{png,pdf}— misidentified % vs Nside / cell size, with one line per strategy (museum + allbor). H&J 2007 Table 2 reference values for Australia and southern Africa overlaid. Annotates the dissolution Nside per strategy. Synthetic strategies are flagged via a translucent banner.figures/iberia_hotspots_nside128.{png,pdf}— 2x2 grid: rows = strategies, columns = (atlas hotspots, rangemap hotspots) at Nside=128 (~50 km cells, the H&J ~0.5° equivalent). Synthetic panels carry a diagonal “DEMO DATA” banner.
DOMAIN.md / USER_PREFERENCES.md style:
matplotlib.use('Agg')is forbidden (blocks inline display).plt.show()after everyfig.savefig()for MyST inline output.DPI = 150, style sheet “seaborn-v0_8-whitegrid”.
import json
from pathlib import Path

import cartopy.crs as ccrs
import cartopy.feature as cfeature
import matplotlib.pyplot as plt
import numpy as np
import pandas as pd
import xarray as xr
from healpix_geo import nested as hp_nested
from matplotlib.patches import Polygon as MplPolygon

plt.style.use("seaborn-v0_8-whitegrid")
ROOT = Path("..").resolve()
DATA = ROOT / "data"
CLEAN_DIR = DATA / "clean"
RAW_DIR = DATA / "raw"
RESULTS_DIR = ROOT / "results"
FIGURES_DIR = ROOT / "figures"
FIGURES_DIR.mkdir(parents=True, exist_ok=True)
STRATEGIES = ["museum", "allbor"]
STRATEGY_LABELS = {
"museum": "Museum + sensors (PRESERVED_SPECIMEN + MACHINE_OBSERVATION)",
"allbor": "All observations (incl. citizen-science HUMAN_OBSERVATION)",
}
STRATEGY_COLORS = {
"museum": "#1f77b4", # blue
"allbor": "#d62728", # red
}
STRATEGY_MARKERS = {
"museum": "o",
"allbor": "s",
}
STRATEGY_RICHNESS_NC = {
s: CLEAN_DIR / f"richness_{s}.nc" for s in STRATEGIES
}
STRATEGY_SYNTH_FLAGS = {
"museum": RAW_DIR / "USING_SYNTHETIC_DEMO_DATA_museum.txt",
"allbor": RAW_DIR / "USING_SYNTHETIC_DEMO_DATA_allbor.txt",
}
SYNTHETIC = {s: STRATEGY_SYNTH_FLAGS[s].exists() for s in STRATEGIES}
SCALE_PARQUET = RESULTS_DIR / "scale_dependence.parquet"
HOTSPOTS_PARQUET = RESULTS_DIR / "hotspot_cells.parquet"
HEADLINE_JSON = RESULTS_DIR / "headline.json"
ELLIPSOID = "WGS84"
scale_df = pd.read_parquet(SCALE_PARQUET)
hotspots_df = pd.read_parquet(HOTSPOTS_PARQUET)
with open(HEADLINE_JSON) as f:
headline = json.load(f)
print(f"SYNTHETIC per strategy = {SYNTHETIC}")
print(scale_df.to_string(index=False))SYNTHETIC per strategy = {'museum': False, 'allbor': False}
strategy nside cell_size_km n_cells atlas_hotspots_n rangemap_hotspots_n overlap_n overlap_pct_symmetric overlap_pct_asymmetric_hjtable2 misidentified_pct wilcoxon_W wilcoxon_p indistinguishable_at_p10 synthetic
museum 16 407.48 8 1 1 1 100.00 100.00 0.00 13.0 5.468750e-01 True False
museum 32 203.74 29 2 2 1 33.33 50.00 66.67 84.5 6.963420e-03 False False
museum 64 101.87 120 6 6 2 20.00 33.33 80.00 782.0 4.413804e-10 False False
museum 128 50.93 479 24 24 6 14.29 25.00 85.71 7160.0 8.818935e-45 False False
museum 256 25.47 1849 93 93 19 11.38 20.43 88.62 54066.0 4.225639e-195 False False
museum 512 12.73 7364 369 369 46 6.65 12.47 93.35 456570.0 0.000000e+00 False False
allbor 16 407.48 8 1 1 0 0.00 0.00 100.00 0.0 7.812500e-03 False False
allbor 32 203.74 29 2 2 1 33.33 50.00 66.67 91.0 1.075230e-02 False False
allbor 64 101.87 120 6 6 0 0.00 0.00 100.00 1779.5 8.731734e-04 False False
allbor 128 50.93 479 24 24 1 2.13 4.17 97.87 8198.0 9.221313e-46 False False
allbor 256 25.47 1849 93 93 4 2.20 4.30 97.80 35918.5 6.047697e-224 False False
allbor 512 12.73 7364 369 369 37 5.28 10.03 94.72 220606.5 0.000000e+00 False False
Figure 1 — Misidentified % vs Nside / cell size (two strategies)
MAIN_PNG = FIGURES_DIR / "main_result.png"
MAIN_PDF = FIGURES_DIR / "main_result.pdf"

fig, ax = plt.subplots(figsize=(10, 6))

for strategy in STRATEGIES:
    sub = scale_df[scale_df["strategy"] == strategy].sort_values("nside")
    is_synth = SYNTHETIC[strategy]
    label = STRATEGY_LABELS[strategy]
    if is_synth:
        label = label + "  [SYNTHETIC]"
    ax.plot(
        sub["nside"], sub["misidentified_pct"],
        marker=STRATEGY_MARKERS[strategy], markersize=8, lw=2.2,
        color=STRATEGY_COLORS[strategy],
        linestyle="--" if is_synth else "-",
        alpha=0.55 if is_synth else 0.95,
        label=f"{strategy}: {label}",
    )
    # Annotate dissolution Nside if it exists for this strategy.
    diss = headline["strategies"][strategy]["dissolution_nside"]
    if diss is not None:
        diss_row = sub[sub["nside"] == diss].iloc[0]
        ax.annotate(
            f"dissolution\n{strategy}: Nside={diss}\n"
            f"(~{round(diss_row['cell_size_km'], 0):.0f} km)",
            xy=(diss, diss_row["misidentified_pct"]),
            xytext=(8, -8 - 16 * STRATEGIES.index(strategy)),
            textcoords="offset points",
            fontsize=8, color=STRATEGY_COLORS[strategy],
            bbox=dict(boxstyle="round,pad=0.2",
                      facecolor="white",
                      edgecolor=STRATEGY_COLORS[strategy], alpha=0.85),
        )

# H&J 2007 Australia + Southern Africa reference values, plotted at the
# Nside whose cell side approximately matches each H&J lat-lon resolution.
hj_table2 = {
    "Australia": {0.25: 47.8, 0.5: 44.0, 1.0: 40.0, 2.0: 20.0, 4.0: 5.0},
    "Southern Africa": {0.25: 68.6, 0.5: 63.0, 1.0: 22.2, 2.0: 15.0, 4.0: 5.0},
}
hj_nside_for_deg = {0.25: 256, 0.5: 128, 1.0: 64, 2.0: 32, 4.0: 16}
hj_colors = {"Australia": "#ff7f0e", "Southern Africa": "#2ca02c"}
hj_markers = {"Australia": "v", "Southern Africa": "^"}
for region, table in hj_table2.items():
    xs = [hj_nside_for_deg[d] for d in table.keys()]
    ys = list(table.values())
    ax.plot(xs, ys, marker=hj_markers[region], markersize=8, lw=1.2,
            linestyle=":", color=hj_colors[region], alpha=0.65,
            label=f"H&J 2007 {region} (Table 2 reference)")

ax.set_xscale("log", base=2)
nside_vals = sorted(scale_df["nside"].unique().tolist())
ax.set_xticks(nside_vals)
ax.set_xticklabels(nside_vals)
ax.set_xlabel("HEALPix Nside (NESTED)  /  log scale")
ax.set_ylabel("Hotspot mis-identification (%)\nsymmetric set non-overlap of top-5%")


def nside_to_km(n):
    return np.sqrt(5.10e8 / (12 * n * n))


def km_to_nside(k):
    return np.sqrt(5.10e8 / (12 * k * k))


sec = ax.secondary_xaxis("top", functions=(nside_to_km, km_to_nside))
sec.set_xlabel("approx. cell side (km)")

ax.set_ylim(0, 100)
any_synth = any(SYNTHETIC.values())
ax.set_title(
    "Scale-dependence of biodiversity hotspots — Hurlbert & Jetz (2007) replication\n"
    "Iberian birds × HEALPix NESTED × two GBIF basis-of-record strategies"
    + ("  —  contains SYNTHETIC DEMO DATA" if any_synth else ""),
    fontsize=11,
)
ax.legend(loc="lower right", fontsize=8, framealpha=0.92,
          borderaxespad=0.6)

# Per-strategy synthetic banner — translucent text in the plot area, one
# line per synthetic strategy, so the figure honestly tells the reader
# which curve is real.
synth_msgs = [
    f"{s}: DEMO DATA — DOI #2 NOT YET MINTED"
    for s in STRATEGIES if SYNTHETIC[s]
]
if synth_msgs:
    msg = "\n".join(synth_msgs)
    ax.text(
        0.5, 0.62, msg,
        transform=ax.transAxes, ha="center", va="center",
        fontsize=11, color="red", weight="bold",
        bbox=dict(boxstyle="round,pad=0.3", facecolor="white",
                  edgecolor="red", alpha=0.55),
    )

fig.tight_layout()
fig.savefig(MAIN_PNG, dpi=150, bbox_inches="tight")
fig.savefig(MAIN_PDF, bbox_inches="tight")
plt.show()  # required for MyST inline display
/tmp/ipykernel_4775/2456008629.py:65: RuntimeWarning: divide by zero encountered in divide
return np.sqrt(5.10e8 / (12 * k * k))
/tmp/ipykernel_4775/2456008629.py:65: RuntimeWarning: divide by zero encountered in divide
  return np.sqrt(5.10e8 / (12 * k * k))
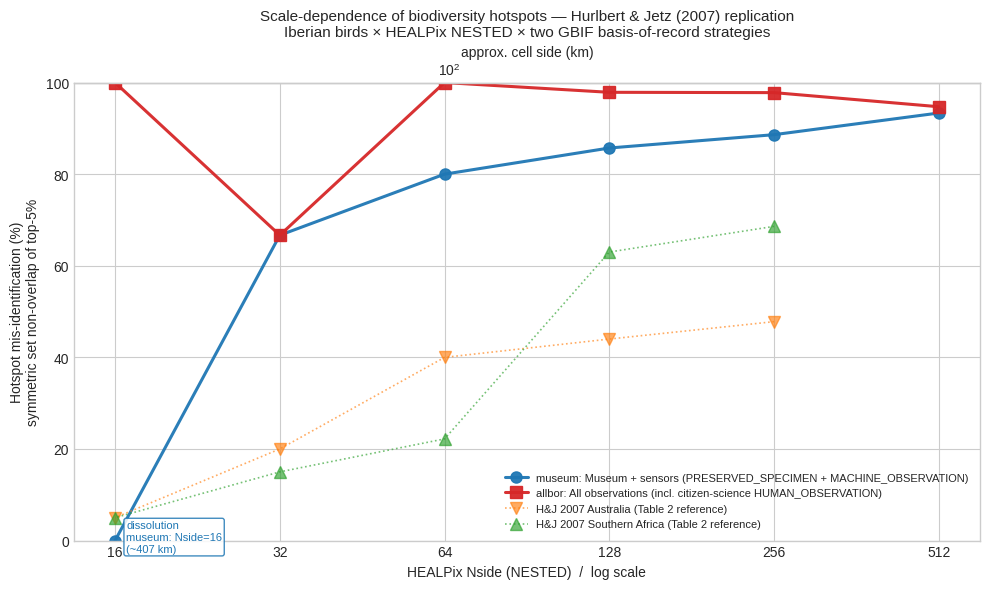
Figure 2 — Iberia hotspot maps (Nside=128, 2x2)
Rows = strategies (museum top, allbor bottom). Columns = atlas hotspots (left, from post-2000 occurrences) and rangemap hotspots (right, from pre-2000 EOO hulls).
MAP_PNG = FIGURES_DIR / "iberia_hotspots_nside128.png"
MAP_PDF = FIGURES_DIR / "iberia_hotspots_nside128.pdf"

NSIDE_MAP = 128
DEPTH_MAP = int(np.log2(NSIDE_MAP))


def cell_polygons(lons: np.ndarray, lats: np.ndarray) -> list:
    """Per-cell (4, 2) lon/lat polygon outline. None on dateline-wrap."""
    polys = []
    for i in range(lons.shape[0]):
        v = np.column_stack([lons[i], lats[i]])
        if (v[:, 0].max() - v[:, 0].min()) > 90:
            polys.append(None)
            continue
        polys.append(v)
    return polys


# Load per-strategy data at Nside=128 once.
strategy_panels = {}
for strategy in STRATEGIES:
    ds = xr.open_dataset(
        STRATEGY_RICHNESS_NC[strategy],
        group=f"nside_{NSIDE_MAP}", engine="netcdf4",
    )
    atlas_r = ds["richness_atlas"].values
    rangemap_r = ds["richness_rangemap"].values
    cells = ds["cell"].values.astype(np.uint64)
    ds.close()

    sub = hotspots_df[(hotspots_df["strategy"] == strategy)
                      & (hotspots_df["nside"] == NSIDE_MAP)]
    atlas_hot_set = set(sub[sub["source"] == "atlas"]["cell_id"])
    rm_hot_set = set(sub[sub["source"] == "rangemap"]["cell_id"])

    verts_lon, verts_lat = hp_nested.vertices(
        cells, DEPTH_MAP, ELLIPSOID, step=1,
    )
    verts_lon = np.where(verts_lon > 180.0, verts_lon - 360.0, verts_lon)
    polys = cell_polygons(verts_lon, verts_lat)
    strategy_panels[strategy] = {
        "atlas_r": atlas_r, "rangemap_r": rangemap_r, "cells": cells,
        "atlas_hot": atlas_hot_set, "rm_hot": rm_hot_set, "polys": polys,
    }


fig, axes = plt.subplots(
    len(STRATEGIES), 2, figsize=(13, 11),
    subplot_kw={"projection": ccrs.PlateCarree()},
)


def draw_panel(ax, polys, cells, richness, hotspot_set, title,
               cmap_name="viridis", is_synth=False):
    ax.set_extent([-10.5, 4.5, 34.5, 44.5], crs=ccrs.PlateCarree())
    ax.add_feature(cfeature.LAND, facecolor="#f6f6f4", zorder=0)
    ax.add_feature(cfeature.OCEAN, facecolor="#dfeefa", zorder=0)
    ax.add_feature(cfeature.COASTLINE, lw=0.5)
    ax.add_feature(cfeature.BORDERS, lw=0.4, edgecolor="#888")
    max_r = max(1, richness.max())
    cmap = plt.get_cmap(cmap_name)
    for i, (poly, r) in enumerate(zip(polys, richness)):
        if poly is None:
            continue
        c = int(cells[i])
        if c in hotspot_set:
            patch = MplPolygon(poly, closed=True,
                               facecolor="#d62728", edgecolor="#9b1c1c",
                               lw=0.3, alpha=0.85, zorder=2,
                               transform=ccrs.PlateCarree())
            ax.add_patch(patch)
        elif r > 0:
            shade = cmap(r / max_r)
            patch = MplPolygon(poly, closed=True,
                               facecolor=shade, edgecolor="none",
                               alpha=0.55, zorder=1,
                               transform=ccrs.PlateCarree())
            ax.add_patch(patch)
    ax.gridlines(draw_labels=True, lw=0.2, color="#cccccc",
                 alpha=0.5, ls="--")
    ax.set_title(title, fontsize=10)
    if is_synth:
        ax.text(
            0.5, 0.5, "DEMO DATA",
            transform=ax.transAxes, ha="center", va="center",
            fontsize=18, color="red", weight="bold",
            rotation=20, alpha=0.55,
            bbox=dict(boxstyle="round,pad=0.4", facecolor="white",
                      edgecolor="red", alpha=0.6),
            zorder=10,
        )


for row, strategy in enumerate(STRATEGIES):
    p = strategy_panels[strategy]
    is_synth = SYNTHETIC[strategy]
    label_suffix = "  [SYNTHETIC]" if is_synth else ""
    draw_panel(
        axes[row, 0], p["polys"], p["cells"], p["atlas_r"], p["atlas_hot"],
        f"{strategy}{label_suffix}\nAtlas (year>=2000) — top-5% hotspots\n"
        f"n={len(p['atlas_hot'])}/{len(p['cells']):,} cells",
        cmap_name="Blues", is_synth=is_synth,
    )
    draw_panel(
        axes[row, 1], p["polys"], p["cells"], p["rangemap_r"], p["rm_hot"],
        f"{strategy}{label_suffix}\nRangemap (year<2000 EOO) — top-5% hotspots\n"
        f"n={len(p['rm_hot'])}/{len(p['cells']):,} cells",
        cmap_name="Greens", is_synth=is_synth,
    )

fig.suptitle(
    f"Iberian bird richness hotspots at HEALPix Nside={NSIDE_MAP} "
    f"(~{round(np.sqrt(5.10e8/(12*NSIDE_MAP**2)), 1)} km cells)  —  "
    f"two BoR strategies",
    fontsize=12, y=1.01,
)

fig.tight_layout()
fig.savefig(MAP_PNG, dpi=150, bbox_inches="tight")
fig.savefig(MAP_PDF, bbox_inches="tight")
plt.show()  # required for MyST inline display

print(f"\nsaved {MAIN_PNG}")
print(f"saved {MAP_PNG}")
/home/runner/work/sdm-scale-replication/sdm-scale-replication/.pixi/envs/default/lib/python3.12/site-packages/cartopy/io/__init__.py:242: DownloadWarning: Downloading: https://naturalearth.s3.amazonaws.com/10m_physical/ne_10m_land.zip
warnings.warn(f'Downloading: {url}', DownloadWarning)
/home/runner/work/sdm-scale-replication/sdm-scale-replication/.pixi/envs/default/lib/python3.12/site-packages/cartopy/io/__init__.py:242: DownloadWarning: Downloading: https://naturalearth.s3.amazonaws.com/10m_physical/ne_10m_ocean.zip
  warnings.warn(f'Downloading: {url}', DownloadWarning)
/home/runner/work/sdm-scale-replication/sdm-scale-replication/.pixi/envs/default/lib/python3.12/site-packages/cartopy/io/__init__.py:242: DownloadWarning: Downloading: https://naturalearth.s3.amazonaws.com/10m_physical/ne_10m_coastline.zip
  warnings.warn(f'Downloading: {url}', DownloadWarning)
/home/runner/work/sdm-scale-replication/sdm-scale-replication/.pixi/envs/default/lib/python3.12/site-packages/cartopy/io/__init__.py:242: DownloadWarning: Downloading: https://naturalearth.s3.amazonaws.com/10m_cultural/ne_10m_admin_0_boundary_lines_land.zip
  warnings.warn(f'Downloading: {url}', DownloadWarning)
saved /home/runner/work/sdm-scale-replication/sdm-scale-replication/figures/main_result.png
saved /home/runner/work/sdm-scale-replication/sdm-scale-replication/figures/iberia_hotspots_nside128.png