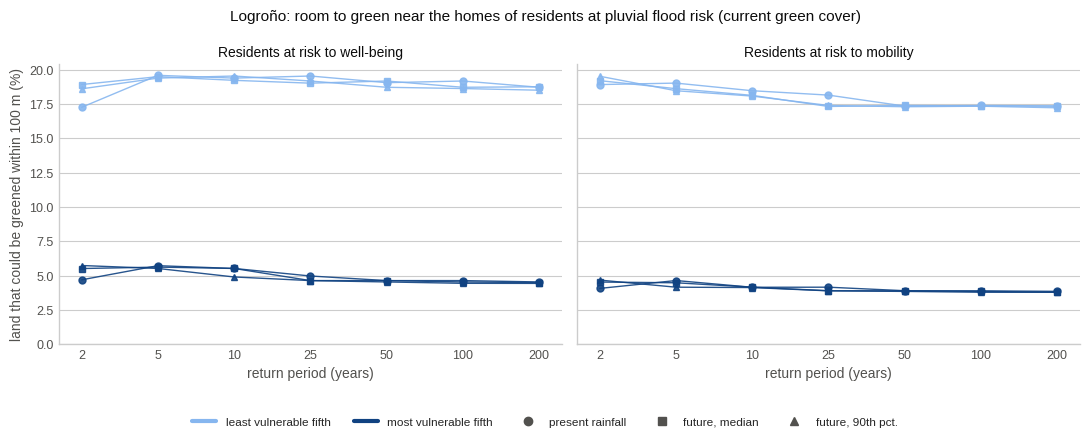
Share of land that could be greened within 100 m of the homes of residents at pluvial
flood risk (current green cover), least against most vulnerable fifth, for every return
period and climate; one panel per risk. Saved to figures/main_result.png and shown
inline (plt.show() after fig.savefig()).
from pathlib import Path

import matplotlib.pyplot as plt
import pandas as pd

RESULTS = Path("../results")
FIGURES = Path("../figures")
FIGURES.mkdir(parents=True, exist_ok=True)
plt.style.use("seaborn-v0_8-whitegrid")
DPI = 150

GROUP_COLOUR = {"q1": "#86b6ef", "q5": "#104281"}
GROUP_LABEL = {"q1": "least vulnerable fifth", "q5": "most vulnerable fifth"}
CLIMATE_MARKER = {"present": "o", "CC_Q50": "s", "CC_Q90": "^"}
CLIMATE_LABEL = {"present": "present rainfall", "CC_Q50": "future, median", "CC_Q90": "future, 90th pct."}
RISK_LABEL = {"PFRWB": "Residents at risk to well-being", "PFRMA": "Residents at risk to mobility"}
TEXT, MUTED = "#0b0b0b", "#52514e"

comp = pd.read_csv(RESULTS / "room_comparisons.csv")
main = comp[(comp["land_cover"] == "Baseline") & (comp["radius_m"] == 100)]
rps = sorted(main["rp"].unique())
fig, axes = plt.subplots(1, 2, figsize=(11, 4.2), sharey=True)
for ax, (risk, label) in zip(axes, RISK_LABEL.items()):
s = main[main["risk"] == risk]
for g in GROUP_COLOUR:
for cl, mk in CLIMATE_MARKER.items():
c = s[s["climate"] == cl].sort_values("rp")
ax.plot([rps.index(r) for r in c["rp"]], 100 * c[f"mean_share_{g}"], marker=mk, ms=5,
lw=1, color=GROUP_COLOUR[g], alpha=0.9)
ax.set_title(label, fontsize=10, color=TEXT)
ax.set_xticks(range(len(rps)), [str(r) for r in rps])
ax.set_xlabel("return period (years)", color=MUTED)
ax.spines[["top", "right"]].set_visible(False)
ax.grid(axis="x", visible=False)
ax.tick_params(colors=MUTED, labelsize=9)
axes[0].set_ylabel("land that could be greened within 100 m (%)", color=MUTED)
axes[0].set_ylim(0, None)
handles = [plt.Line2D([], [], color=GROUP_COLOUR[g], lw=3, label=GROUP_LABEL[g]) for g in GROUP_COLOUR]
handles += [plt.Line2D([], [], color=MUTED, marker=m, lw=0, label=CLIMATE_LABEL[c]) for c, m in CLIMATE_MARKER.items()]
fig.legend(handles=handles, loc="lower center", ncol=5, frameon=False, fontsize=8.5, bbox_to_anchor=(0.5, -0.04))
fig.suptitle("Logroño: room to green near the homes of residents at pluvial flood risk (current green cover)",
fontsize=11, color=TEXT)
fig.tight_layout(rect=(0, 0.06, 1, 1))
fig.savefig(FIGURES / "main_result.png", dpi=DPI, bbox_inches="tight")
plt.show()