This notebook reproduces the headline geometric finding of the replication: when
Law & Ardo (2024)'s discrete-global-grid workflow is run on HEALPix via
healpix-geo, the choice of
reference surface — a bare sphere vs the WGS84 ellipsoid — changes which
cell a point is assigned to, and the effect is strongly latitude-dependent.
It is self-contained (synthetic points, no external data) and runs in seconds, so the Jupyter Book builds it on every push.
import numpy as np
from healpix_geo import nested

# Depth 9 — chosen to match H3 resolution 9 in the benchmark. nside = 2**depth.
# (Mean cell edge ~13 km at this depth; the geodetic-to-authalic latitude shift
# the ellipsoid introduces is of the same order, which is why cells move.)
DEPTH = 9
print(f"HEALPix depth {DEPTH}  ->  nside = 2**{DEPTH} = {2**DEPTH}")
HEALPix depth 9 -> nside = 2**9 = 512
Index the same region on the sphere and on WGS84
Following the replication, we take a 2-D region (a lon/lat patch, like a
raster tile) centred at a given latitude, and assign every point to its NESTED
HEALPix cell twice — ellipsoid="sphere" and ellipsoid="WGS84". We report
the fraction of points that land in a different cell. (A single latitude line
would give a degenerate answer; a 2-D patch mirrors how real EO rasters are
gridded.)
def fraction_in_different_cell(lat_center, n=400_000, half_lat=3.0, half_lon=5.0, seed=0):
    rng = np.random.default_rng(seed)
    lat = rng.uniform(lat_center - half_lat, lat_center + half_lat, n)
    lon = rng.uniform(-half_lon, half_lon, n)
    sphere = nested.lonlat_to_healpix(lon, lat, DEPTH, ellipsoid="sphere")
    wgs84 = nested.lonlat_to_healpix(lon, lat, DEPTH, ellipsoid="WGS84")
    return np.count_nonzero(sphere != wgs84) / n


lat_bands = [0, 15, 30, 45, 48, 60, 75]
rows = [(lat, fraction_in_different_cell(lat)) for lat in lat_bands]

print(f"{'region centre':>14} {'cells differ':>13}")
for lat, frac in rows:
    print(f"{lat:>13}° {100*frac:>12.1f}%")
region centre cells differ
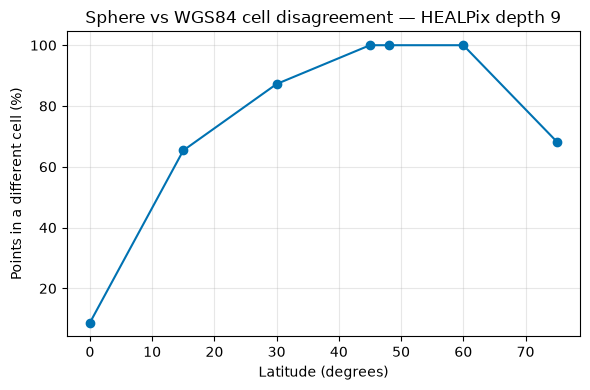
0° 8.7%
15° 65.4%
30° 87.2%
45° 100.0%
48° 100.0%
60° 100.0%
75° 68.3%
The pattern matches the replication’s reported result: cell assignment is barely affected near the equator but diverges sharply at the mid-latitudes of European Earth-observation data (~+48°), where most points land in a different cell once the WGS84 ellipsoid is accounted for. The cells are the same size — they are simply shifted — but per-point assignment is not interchangeable between the two reference surfaces. Ignoring the ellipsoid therefore bakes a latitude-dependent bias into any Copernicus-resolution analysis.
# Note: do NOT force the Agg backend here. Under nbclient/jupyter-execute the
# IPython inline backend captures the figure as the cell's display output, which
# is what MyST renders in the book. Forcing Agg makes plt.show() a no-op, so the
# figure would only hit disk and never appear on the page.
import matplotlib.pyplot as plt

lats = [r[0] for r in rows]
frac = [100 * r[1] for r in rows]

fig, ax = plt.subplots(figsize=(6, 4))
ax.plot(lats, frac, "o-", color="#0072B2")
ax.set_xlabel("Latitude (degrees)")
ax.set_ylabel("Points in a different cell (%)")
ax.set_title(f"Sphere vs WGS84 cell disagreement — HEALPix depth {DEPTH}")
ax.grid(True, alpha=0.3)
fig.tight_layout()
plt.show()