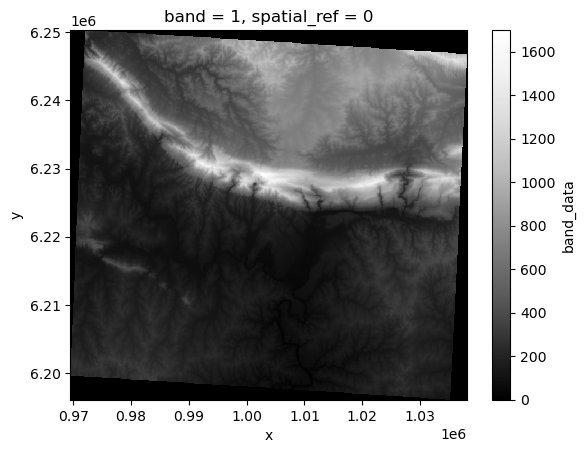
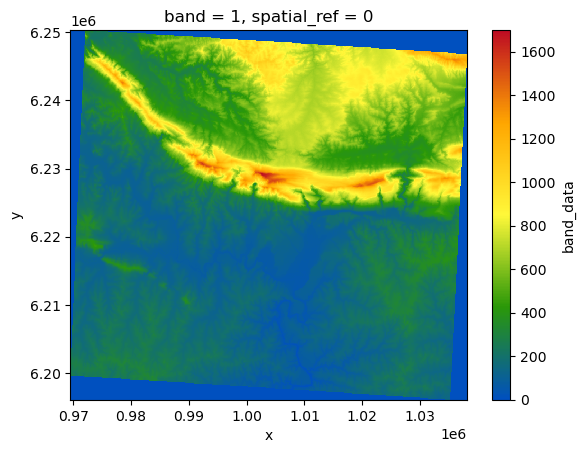
<xarray.Dataset>
Dimensions:      (band: 1, x: 837, y: 661)
Coordinates:
  * band         (band) int64 1
  * x            (x) float64 9.695e+05 9.696e+05 ... 1.038e+06 1.038e+06
  * y            (y) float64 6.25e+06 6.25e+06 6.25e+06 ... 6.196e+06 6.196e+06
    spatial_ref  int64 ...
Data variables:
band_data (band, y, x) float32 ...PandasIndex
PandasIndex(Index([1], dtype='int64', name='band'))
PandasIndex
PandasIndex(Index([ 969532.2721167546,  969614.2655429505,  969696.2589691463,
        969778.2523953422,   969860.245821538,   969942.239247734,
        970024.2326739299,  970106.2261001257,  970188.2195263216,
        970270.2129525176,
       ...
       1037340.8355807507, 1037422.8290069466, 1037504.8224331425,
       1037586.8158593384, 1037668.8092855343, 1037750.8027117301,
        1037832.796137926, 1037914.7895641219, 1037996.7829903178,
       1038078.7764165137],
dtype='float64', name='x', length=837))PandasIndex
PandasIndex(Index([ 6250255.998851344,  6250174.005425148,  6250092.011998952,
        6250010.018572756,  6249928.025146561, 6249846.0317203645,
        6249764.038294169,  6249682.044867973,  6249600.051441777,
        6249518.058015581,
       ...
        6196878.278397824,  6196796.284971627,  6196714.291545432,
        6196632.298119236, 6196550.3046930395,  6196468.311266844,
        6196386.317840648,  6196304.324414453,  6196222.330988256,
        6196140.337562061],
      dtype='float64', name='y', length=661))