GEO4060 Project Assignment 2015
A simple library for image processing
- What is a PGM image?
- Convert to a binary image
- Edge detection
- Recontruct initial image from its edges
- Unit testing framework
- Performance analysis: timing your application
- The project assignement
- The final time of delivery
- Setup of your git repository
What is a PGM image?
You can view PGM pictures using the display program from the Image Magick suite (http://www.imagemagick.org/). Image Magick is available on a wide range of platforms including Unix/linux, Mac OS X, and Windows.
On a linux platform, you can
visualize a PGM picture with the display program:
display output.pgm
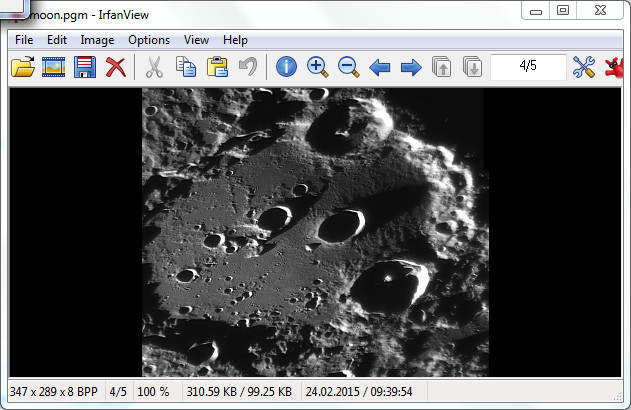
Here is what you should see if you display moon.pgm:

A PGM image consists of a sequence of one or more PGM images. There are
no data, delimiters, or padding before, after, or between images.
Each PGM image consists of the following:
- A "magic number" for identifying the file type. A pgm image's magic number is the two characters "P5".
- Whitespace (blanks, TABs, CRs, LFs).
- A Width, formatted as ASCII characters in decimal.
- Whitespace.
- A Height, again in ASCII decimal.
- Whitespace.
- The maximum gray value (Maxval), again in ASCII decimal. Must be less than 65536, and more than zero.
- A single whitespace character (usually a newline).
- A raster of Height rows, in order from top to bottom. Each row consists of Width gray values, in order from left to right. Each gray value is a number from 0 through Maxval, with 0 being black and Maxval being white. Each gray value is represented in pure binary by either 1 or 2 bytes. If the Maxval is less than 256, it is 1 byte. Otherwise, it is 2 bytes. The most significant byte is first.
"#" may be comments.
Convert to a binary image
It is sometimes convenient to convert a grayscale image into a binary image, based on a threshold \(t\).
To transform a PGM image into a binary image, you would need to loop over the entire image and replace each gray values by \(0\) if \( pic(i,j) <= t \) and \(1\) if \( pic(i,j) > t \).
Here \(pic(i,j)\) is the gray value and \(i=1,...,Width\) and \(j=1,...,Height\).
Can the resulting image can be stored in PGM format?
Edge detection
The goal is to implement a simple graphics-processing method for detecting the edges of features contained in a picture. For simplicity, we define the edges of a picture by comparing the values of each pixel to its four nearest neighbours:
- If a pixel has the same value as its four surrounding neighbours (i.e. no edge) then the value of \(edge(i, j)\) will be zero.
- If the pixel is very different from its four neighbours (i.e. a possible edge) then \(edge(i, j)\) will be large in magnitude. If you are familiar with the discretization of partial differential equations, you will recognise that edge is the second derivative of \(pic\).
- We will always consider \(i\) and \(j\) to lie in the range \(1, 2, . . . Width\) and \(1, 2, . . . Height\) respectively.
- Pixels that lie outside this range (e.g. \(pic(i, 0)\) or \(pic(Width + 1, j)\)) are set to zero.
- To implement this algorithm, you will first need to be able to read in a picture.
- The result of your edge detection will be stored in a PGM image too. Therefore you also need to implement a routine to write a PGM image.
- Note that the arrays have to be extended in each dimension to accommodate the boundary conditions. We can implement the boundary conditions by setting these halos to zero. You should take care that computation only take place on the interior of the pictures, e.g. loops should start at 1 and not 0.
- Implement the edge detection method above to compute the edges in newpic based on the input stored in oldpic, and look at the output picture.
- How can you validate your edge detection method?
- Run the code on multiple images and check that it works correctly.
- define a new data structure (the simplest one would be an array; but it may not be the best one...) called edge
- read the initial edges data file into bigpic
- zero the arrays oldpic, newpic and edge
- scatter bigpic to edge and set oldpic = edge
- repeat for many iterations:
- loop over \(i = 1, 2 . . . Width; j = 1, 2, . . . Height\)
- end loop
- set oldpic = newpic
- end loop over iterations
- write out the final picture as before
Recontruct initial image from its edges
It is actually possible to do the inverse operation, i.e. to reconstruct the initial picture from its edges. This requires multiple iterations and you should be able to reconstruct the original picture as follows:\[ newpic(i,j) = {1 \over 4} \{ oldpic(i-1,j) + oldpic(i+1,j) + \\ \qquad \qquad \quad oldpic(i,j-1) + oldpic(i,j+1) - edge(i,j) \} \]
Implement this reverse algorithm and explain how you can verify your code. For instance, can you easily create a "fake" image? You should start to see the original picture emerging after around 1000 iterations; after 100000 it should be practically indistinguishable from the original. Rather than running for a fixed number of iterations, it is better to stop when the output picture has converged to some tolerance, i.e. when it changes very little between each iteration. We can quantify this by computing \(\Delta\) defined by: \[ \Delta ^2 = {1 \over Width \times Height} \sum _{i=1;j=1} ^{Width;Height} (newpic(i,j) -oldpic(i,j))^2 \] and stopping when \(\Delta\) is less than some tolerance, e.g. 0.1. Use a larger picture (as supplied) and time your program to measure the time (CPU and elapsed).
Unit testing framework
Each tool (main program) and subroutine/function must be carefully tested and these tests may need to be reproduced if a developer changes the implementation of a routine/function. This is what we called unit testing.
For our project, you need to make sure that every function and main program can be tested we "fake images". A "Fake" image is an image that has been created "manually" or with a known algorithm and for which it is straightforward to get the result of the tested routine. When testing a routine, you need to compare the generated result with a reference that we have previously produced.
Performance analysis: timing your application
It is important to be able to time your application and have a detailed overview of the performance of your code. For this, you will implement a module containing routines to time each subroutine/functions of your tools. We wish to have a standardized outputs such as:
      Copyright (C) 2015, UIO

     Process CPU Time (s) | Process Elapsed Time (s)
     =====================|==========================
               0.030      |           0.030
     =====================|==========================

     Started on 04/03/2015 at 21:10:18 MET +01:00 from GMT
     Stopped on 04/03/2015 at 21:10:18 MET +01:00 from GMT
CPU time is the time for which the CPU was busy executing the task. It does not take into account the time spent in waiting for I/O (disk IO or network IO). Since I/O operations, such as reading files from disk, are performed by the OS, these operations may involve noticeable amount of time in waiting for I/O subsystems to complete their operations. This waiting time will be included in the elapsed time, but not CPU time. Hence CPU time is usually less than the elapsed time.
To measure the CPU time of your code, you can use
CPU_TIME Fortran intrinsic subroutine:
   REAL(kind=8)  :: start_time, end_time
   ...
   call CPU_time(start_time)
   ...
   call CPU_time(end_time)

   print*, 'CPU time = ', end_time - start_time
To measure the elasped time:
   INTEGER      :: ir
   real(kind=8) :: elapsed_time_start, elapsesd_time_end
   ...
  CALL SYSTEM_CLOCK(COUNT=elapsed_time_start, count_rate=ir)
  ...

  CALL SYSTEM_CLOCK(COUNT=elapsed_time_end)
  print*, 'Elapsed time = ', (elapsed_time_end - elapsed_time_start ) / real(ir)
When running a code in "production" i.e. to get scientific results (not during the development phase), you would like to disable these timings as they may slow down your code.
For this you can for instance define a logical called USE_TIMING which call timing routines when true; for instance:
 LOGICAL :: USE_TIMING
 ...
 if (USE_TIMING) call timeAppInit()
 ...
 if (USE_TIMING) call timeAppEnd()
The value of USE_TIMING will be an input parameter of your tool (value chosen by users).
The project assignement
The purpose of the project assignment is to create a set of tools to manipulate and process PGM images. You will have to:
- define an appropriate data structure (object) for PGM images, taking into account that your library could be extended in the future to handle various format. You must justify your choice in a separate document.
- a routine to read PGM image
- a routine to write PGM image
- a routine to convert a PGM image into a binary (0 or 1) image with a threshold chosen by the user.
- a routine for edge detection
- routines to time your application: we should be able to measure and print information concerning the CPU and elapsed time
- program(s) for users to run the implemented algorithms on a PGM image of their choice
- a makefile or a simple Unix shell script for compiling and linking the application must be provided. You must provide a simple way to compile your application in debug mode i.e. with debug compiler options and ``standard'' mode.
- a log file should be created by default with information on the run (which subroutines were called, time spent in each subroutine, etc.) and a silent mode (no log file) must be provided too.
- your application and each tool much be tested (unit testing framework) and it must be easy to redo these tests if required. A test can be for instance reading a PGM file and write it back into another file and then compare (diff) the two files.
- a documentation must be provided, explaining how to use the set of tools you have implemented and how to extend them (a cookbook for implementing new image processing algorithms, new data formats, new tools)
- your source code must be stored in a repository (github, bitbucket, etc.) and I need to be able to access it.
The final time of delivery
The final time of delivery is Friday 22.05.2015 at 23:59
Setup of your git repository
On sverdrup in the directory of your choice:
mkdir ProjectFortran
cd ProjectFortran
git config --global user.name "Your Name"
git config --global user.email "you@some.domain"
git config --global color.ui "auto"
git config --global core.editor "your_editor"
git init
Display the status of the repository:
git statusAdd specific files to the staging area:
git add filename_1 filename_2Commit changes in the staging area to the repository's history: (Without -m and a message, this command runs a text editor.)
git commit -m "Some message explaining your changes"
If you need to create a Makefile to compile your code, start from one example provided in github/Fortran.
Once you have finished your project, you can either use github or bitbucket to store it and make it accessible (at least to me) or you can send me a tarball containing your project:
cd ..
tar cvf ProjectFortran.tar ProjectFortran
gzip ProjectFortran.tar
This command is to be done in the same directory you have created ProjectFortran directory. The resulting file is then called
ProjectFortran.tar.gz.
Please note that you do not need to send the data directory (containg PGM images).